(2: 广西大学土木建筑工程学院,南宁 530004)
(3: 广西水环境监测中心,南宁 530023)
(2: College of Civil Engineering and Architecture, Guangxi University, Nanning 530004, P.R. China)
(3: Water Environment Monitoring Center of Guangxi Province, Nanning 530023, P.R. China)
在河流水质监测中,利用水生生物对周围环境因子变化的响应,分析其生理功能、种类丰度、种群密度、群落结构等特征,能够较全面地反映水体在一段时间内的污染状况,在一定程度上补充了传统水质监测的不足[1-3].近年来,生物监测在河流健康评价体系中发挥着重要作用[4],其灵敏度高、综合性强等特点[5],已被许多国家纳入本地区河流健康诊断与治理计划中,并且也得到成熟运用.
许多学者对底栖硅藻的研究表明,硅藻与流速、水深、pH、营养元素、电导率等理化因子具有一定的相关性[6-10],同时也会受到土地利用、地形地貌、季节变迁、植被和气候变化的影响[11-14].基于底栖硅藻的水质评价中,仍存在一些不确定因子会干扰实验结果,例如空间变化、时间变化、取样方法、样本的制备、样本的分析、研究人员因素等,最终会影响分析评价的客观准确性[15-18].本文将从取样方法及样本制备的角度出发,分别采集同一条河流的不同样点和跨河流的硅藻样品,评估一些人为因素引起群落结构的差异大小,也可为广西桂北区域的河流硅藻生物水质评价提供一定的参考意义.
1 材料与方法 1.1 样点概况及设置为进行此次验证性工作,将分别从漓江、贺江、刁江、龙江和贝江中采集硅藻样品.这些江都受到不同程度的人为活动干扰,包括农林业活动、城镇化、水利建筑设施,其中贺江、龙江、刁江上游局部地区采矿业较密集,发生过重金属污染事件.
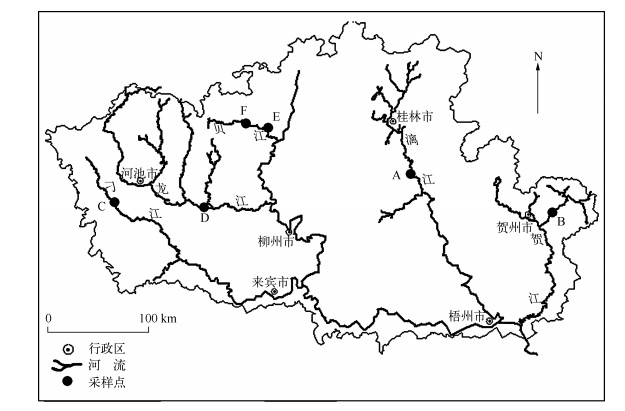
位于漓江的阳朔设为A(24°47′01″N,110°29′42″E),贺江的大宁样点设为B(24°33′47″N,111°54′23″ E),刁江的下考乡样点设为C(24°40′12″N,107°44′20″E),龙江的宜州样点设为D(24°30′26″N,108°35′52″E),贝江的等塘和沟滩样点分别设为E(25°13′06″N,109°10′04″E)和F(25°08′46″N,109°13′23″E)(图 1).其中A点为旅游景区,河流底质主要以鹅卵石、砾石、细砂等沉积物,水流条件较好且水体透明度高,植被覆盖率较好,受到一定人为活动干扰;B点与D点处在城镇河段上游,河流底质主要是大石、碎石,水体透明度较高,水流条件较好,但各自水量都受到上游水利枢纽的影响,附近植被覆盖率一般;C、E、F点两岸基本是经济林区,河岸稳定,河流底质为鹅卵石、砾石、细砂等沉积物,水流条件较好,流量不大,水体清澈,属浅水型河流,周围植被覆盖率高.

|
图 1 采样点位置 Fig.1 Location of sampling sites in the rivers |
于2014年3月对上述5条河流进行硅藻采样.参考欧州技术标准EN 13946[19],样点选择在地势开阔且无树荫遮挡处,选取能抵抗一定水流冲击的石头,每个样品至少选取5块石头,采集范围控制在大约5 m2内,并用干净的牙刷刷洗石头的向阳面,再装入样品瓶中,加入甲醛(3%~4%)固定保存.最后带回实验室,经过氧化消解后,制成合格的永久玻片,每个样品重复相同步骤制成5个玻片,并分别编号为A1-5、B1-5、C1-5、D1-5,共有20个玻片.另外,在E和F样点中,分别采集两组样品,每组沿着垂直河流水流方向,水深依次由浅到深,采集5个样品,每个样品采集方法和上述一样,但采集范围控制在大约2 m2内.每个样品分别制作成一个永久玻片,并分别编号为E1-5、F1-5,一共有10个玻片.
1.3 硅藻鉴定计数及分析参考欧洲技术标准EN 14407[20],在光学显微镜下采用1000倍油镜鉴定,视野内所有硅藻及破损面积不超过1/4的样品都要进行鉴定和计数,每个玻片鉴定的总数大于400个.硅藻种类的鉴定主要根据Krammer和Lange-Bertalot的鉴定体系[21].
采用DCA(CANOCO4.5)分析硅藻群落结构与样品采集及处理过程中的变量关系,排序分析过程中剔除每个样点里相对丰度小于1%的藻种,并对其进行平方根转换.现将所有样本分成两组进行DCA分析(第1组A1-5、B1-5、C1-5、D1-5和第2组E1-5、F1-5),再对DCA中每个物种的得分进行ANOVA(SPSS 18.0)分析,将所得方差分量与DCA中各轴的解释量相乘,相加后的和便是本组样本在不同尺度下群落差异的实际大小.另外为比较河流间、同一条河流不同样点间、同一样点不同样品间、子样本间的差异大小,以第1组差异大小作为参考量,将第2组(E1-5、F1-5)中群落结构的分析值乘以比例(第2组特征值/第1组特征值)[22].
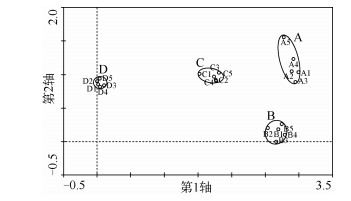
2 结果对第1组样本(分别从4条不同河流中采集的样品,并将每个样品制成5个玻片)进行DCA排序分析的结果可知,总特征值为1.679,DCA轴1解释了群落结构变化的35.7%,轴2解释了群落结构变化的7.6% (图 2).将DCA轴1得分进行ANOVA分析,发现河流间和子样本间的硅藻群落结构方差分量分别占99.02%和0.98%,其中F(3,16)=538.787,P<0.001,很显然河流间的群落结构差异远远大于子样本间的差异;将DCA轴2得分进行ANOVA分析,发现河流间与子样本间硅藻群落结构方差分量分别占87.97%和12.03%,其中F(3,16)=38.969,P<0.001,也说明河流间的群落结构差异大于子样本间的差异.因此,河流间的硅藻群落结构实际差异大小为99.02% ×35.7% +87.97% ×7.6% =42.03%,子样本间实际差异大小为0.98% ×35.7% +12.03% ×7.6% =1.26%.

|
图 2 每条河流的5个玻片样本的DCA排序结果 Fig.2 DCA scores from the 5 slides for each stream |
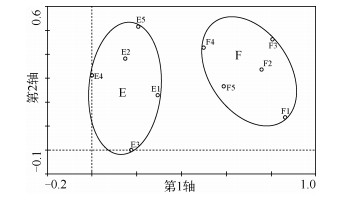
对第2组样本(从第5条河流中两个样点采集的10个样品,并将每个样品制成1个玻片)进行DCA排序分析的结果可知,总特征值为0.228,DCA轴1解释了群落结构变化的39.3%,轴2解释了群落结构变化的12.2% (图 3).将DCA轴1得分进行ANOVA分析,显示样点间与样品间的硅藻群落结构方差分量分别占63.25%和36.75%,其中F(1,8)=13.741,P=0.006,样点间的群落结构差异大于样品间的差异;将DCA轴2得分进行ANOVA分析,显示样点间与样品间硅藻群落结构方差分量分别占1.91%和97.71%,其中F(1,8) =0.169,P=0.691,无显著差异.因此,样点间的硅藻群落结构实际差异大小为63.25% ×39.3% ×0.228/1.679=3.38%,样品间实际差异大小为36.75% ×39.3% ×0.228/1.679=1.97%.

|
图 3 贝江中每个样点5个样本的DCA排序结果 Fig.3 DCA scores from the 5 samples collected at 2 sites in the Bei River |
综上所述,采样和样品处理分析过程中引起的群落差异比较为:跨河流间差异(42.03%)>同一条河流不同样点间差异(3.38%)>相同样点的不同样品间差异(1.97%)>同一样品的子样本间差异(1.26%).
3 讨论与结论就样品采集和处理过程对硅藻群落结构对比,发现除了在河流间、样点间会出现群落结构差异,在样品间及子样本间的群落结构也不是完全一致的,只是差异很小.
这4条河流间的硅藻群落结构差异性达到了42.03%,河流中的生物群落,除了受到水体理化因子的影响外,与其所处生态分区也有一定的关系[23]. A点所在的漓江属于旅游景区,周围的生境条件良好;B点所在的贺江受采砂、农田及城镇化等干扰;C点所在的刁江受上游地区采矿及沿岸农田影响,且河流的径流量较小;D点所在的龙江与刁江相邻,受到城镇化、采矿活动及梯级电站开发影响.另外河流之间相隔较远,由于空间效应[24],导致这些河流间群落结构差异性较大.在第5条河流贝江中,E、F两个样点间的差异性只有3.38%,两样点的群落结构相似性较高,这跟其流域特征有一定的关系,贝江流域面积相对较小,年径流量也不大,作为柳州水源地,其水质条件整体优良[25],两个样点间的河段人口密度小,两岸翠山环抱,植被覆盖率好,也没有水利建筑设施等人为干扰,基本处于天然状态.除了生境条件比较接近外,可能还跟这两点相隔的距离比较近有关,Hillebrand等发现硅藻种群的相似性随着距离的增加而减小[26],两个样点群落差异性的可能因素是物种自身传播[27-28]以及与其他生物的互相作用[29],同一河流相隔较远的样点群落结构差异性会比较明显.而在同一个样点的5个样品间以及同一样品制成的5个玻片间的群落结构差异大小分别为1.26%和1.97%,引起差异性的原因可能是由于人员对藻种的鉴定带有一定主观性[30],另外样品采集[31]和制作玻片过程中也可能存在一些偶然因素.在整个数据采集过程中,尽管会引起一些误差,但是其差异性大小都不足2%,基本可以忽略这些因素带来的影响.
来自不同基质的硅藻种群也会有差异性,Kitner等[32]发现附石、附植、附泥沙中硅藻种群多样性有较大不同,但Winter等[33]和Cejudo-Figueiras等[34]则认为种群结构差异受基质影响不明显.为了避免因基质不同对结果产生干扰,所有样点统一选取石头上的硅藻.另外Mykrä等[31]报道了在芬兰北部河流中的硅藻群落与季节变迁有关,O'Driscoll等[35]在北爱尔兰Burrishoole流域却未发现本地区硅藻群落的季节性变化,这可能是流域频发洪水的水文特征导致的.此次实验数据只反映了春季的情况,属于平水期,在其他季节,不同尺度下的种群差异性是否会增大或者减小,在文中未进行验证,但样点间差异大于样品间差异的结论,与Kelly[36]对比硅藻群落结构在年际间的变化差异结果是一致的.
本文评价了样品采集和处理过程中可能带来的误差大小.跨河流及不同样点间的群落差异较明显,这主要是因为水体中的理化条件不同,而样品采集和样本制备中出现的偶然因素对群落结构的干扰远小于理化因子、生态分区、空间距离等因素的影响.
| [1] |
房英春, 刘广纯, 田春等. 浅析河流水体污染的生物监测及指标生物. 水土保持研究, 2005, 12(2): 151-153. |
| [2] |
赵彦伟, 杨志峰. 河流健康:概念、评价方法与方向. 地理科学, 2005, 25(1): 119-124. |
| [3] |
王静, 池玉林, 陈正西. 利用底栖动物进行水质监测与评价的研究进展. 安徽农业科学, 2012, 40(22): 11401-11405. DOI:10.3969/j.issn.0517-6611.2012.22.093 |
| [4] |
汪星, 刘录三, 李黎. 生物监测在跨界河流中的应用进展. 中国环境监测, 2014, 30(2): 170-177. |
| [5] |
阴琨, 吕怡兵, 滕恩江. 美国水环境生物监测体系及对我国生物监测的建议. 环境监测管理与技术, 2012, 24(5): 8-12. |
| [6] |
van Dam H, Mertens A, Sinkeldam JA. Coded checklist and ecological indicator values of freshwater diatoms from the Netherlands. Netherlands Journal of Aquatic Ecology, 1994, 28: 117-133. DOI:10.1007/BF02334251 |
| [7] |
吴乃成, 唐涛, 周淑婵等. 香溪河小水电的梯级开发对浮游藻类的影响. 应用生态学报, 2007, 18(5): 1091-1096. |
| [8] |
蔡德所, 黎佛林, 文宏展. 广西金鸡滩库区水深梯度下的硅藻生态特征研究. 三峡大学学报:自然科学版, 2014, 36(2): 1-5. |
| [9] |
Ponader KC, Charles DF, Belton TJ. Diatom-based TP and TN inference models and indices for monitor-ing nutrient enrichment of New Jersey streams. Ecological Indicators, 2007, 7(1): 79-93. DOI:10.1016/j.ecolind.2005.10.003 |
| [10] |
邓培雁, 雷远达, 刘威等. 桂江流域附生硅藻群落特征及影响因素. 生态学报, 2012, 32(7): 2196-2203. |
| [11] |
Leland HV. Distribution of phytobenthos in the Yakima River basin, Washington, in relation to geology, land use and other environmental factors. Canadian Journal of Fisheries and Aquatic Sciences, 1995, 52(5): 1108-1129. |
| [12] |
Hlúbiková D, Novais MH, Dohet A et al. Effect of riparian vegetation on diatom assemblages in headwater streams under different land uses. Science of the Total Environment, 2014, 475: 234-247. DOI:10.1016/j.scitotenv.2013.06.004 |
| [13] |
Drira Z, Elloumi J, Guermazi W et al. Seasonal changes on planktonic diatom communities along an inshore-offshore gradient in the Gulf of Gabes (Tunisia). Acta Ecologica Sinica, 2014, 34(1): 34-43. DOI:10.1016/j.chnaes.2013.11.005 |
| [14] |
刘彩, 刘道辰, 陈诗越等. 附着硅藻的研究进展. 聊城大学学报:自然科学版, 2013(3): 47-51. |
| [15] |
Kelly M, Bennion H, Burgess A et al. Uncertainty in ecological status assessments of lakes and rivers using diatoms. Hydrobiologia, 2009, 633(1): 5-15. DOI:10.1007/s10750-009-9872-z |
| [16] |
Barbour MT, Gerritsen J, Snyder BD et al. Rapid bioassessment protocols for use in streams and wadeable rivers: Periphyton, benthic macroinvertebrates, and fish. Washington, DC: Environment Protection Agency, 1999.
|
| [17] |
Clarke RT. Estimating confidence of European WFD ecological status class and WISER Bioassessment Uncertainty Guidance Software (WISERBUGS). Hydrobiologia, 2013, 704(1): 39-56. DOI:10.1007/s10750-012-1245-3 |
| [18] |
Bennett C, Owen R, Birk S et al. Bringing European river quality into line: an exercise to intercalibrate macroinvertebrate classification methods. Hydrobiologia, 2011, 667(1): 31-48. |
| [19] |
EN 13946: Water quality-Guidance standard for the routine sampling and pre-treatment of benthic diatoms from rivers, 2003.
|
| [20] |
EN 14407: Water quality-Guidance standard for the identification, enumeration and interpretation of benthic diatom samples from running waters, 2004.
|
| [21] |
Krammer K, Lange-Bertalot H. Bacillariophyceae. Berlin: Spektrum Akademischer Verlag GmbH Heidelberg, 2000.
|
| [22] |
Lavoie I, Somers KM, Paterson AM et al. Assessing scales of variability in benthic diatom community structure. Journal of Applied Phycology, 2005, 17(6): 509-513. |
| [23] |
Soininen J. Determinants of benthic diatom community structurein boreal streams: the role of environmental and spatial factors at different scales. International Review of Hydrobiology, 2004, 89(2): 139-150. DOI:10.1002/(ISSN)1522-2632 |
| [24] |
Heino J, Bini LM, Karjalainen SM et al. Geographical patterns of micro-organismal community structure: are diatoms ubiquitously distributed across boreal streams?. Oikos, 2010, 119(1): 129-137. DOI:10.1111/oik.2010.119.issue-1 |
| [25] |
唐鑫, 蔡德所, 黎佛林等. 贝江硅藻生态群落特征及水质评价. 三峡大学学报:自然科学版, 2013, 35(6): 1-5. |
| [26] |
Hillebrand H, Watermann F, Karez R et al. Differences in species richness patterns between unicellular and multicellular organisms. Oecologia, 2001, 126(1): 114-124. |
| [27] |
Smucker NJ, Vis ML. Spatial factors contribute to benthic diatom structure in streams across spatial scales: Considerations for biomonitoring. Ecological Indicators, 2011, 11(5): 1191-1203. DOI:10.1016/j.ecolind.2010.12.022 |
| [28] |
Černá K. Small-scale spatial variation of benthic algal assemblages in a peat bog. Limnologica-Ecology and Management of Inland Waters, 2010, 40(4): 315-321. DOI:10.1016/j.limno.2009.11.015 |
| [29] |
Borcard D, Legendre P. Environmental control and spatial structure in ecological communities: an example using oribatid mites (Acari, Oribatei). Environmental and Ecological Statistics, 1994, 1(1): 37-61. |
| [30] |
Prygiel J, Carpentier P, Almeida S et al. Determination of the biological diatom index (IBD NF T 90-354): results of an intercomparison exercise. Journal of Applied Phycology, 2002, 14(1): 27-39. |
| [31] |
Mykrä H, Saarinen T, Tolkkinen M et al. Spatial and temporal variability of diatom and macroinvertebrate communities: How representative are ecological classifications within a river system?. Ecological Indicators, 2012, 18: 208-217. |
| [32] |
Kitner M, Poulícková A. Littoral diatoms as indicators for the eutroPhication of shallow lakes. Hydrobiologia, 2003, 506/507/508/509(1/2/3): 519-524. |
| [33] |
Winter JG, Duthie HC. Stream epilithic, epipelic and epiphytic diatoms: habitat fidelity and use in biomonitoring. Aquatic Ecology, 2000, 34(4): 345-353. |
| [34] |
Cejudo-Figueiras C, álvarez-Blanco I, Bécares E et al. Epiphytic diatoms and water quality in shallow lakes: the neutral substrate hypothesis revisited. Marine and Freshwater Research, 2010, 61(12): 1457. DOI:10.1071/MF10018 |
| [35] |
O'Driscoll C, Eyto E, Rodgers M et al. Spatial and seasonal variation of peatland-fed riverine macroinver-tebrate and benthic diatom assemblages and implications for assessment: a case study from Ireland. Hydrobiologia, 2014, 728(1): 67-87. DOI:10.1007/s10750-014-1807-7 |
| [36] |
Kelly MG. Role of benthic diatoms in the implementation of the urban wastewater treatment directive in the River Wear, north-east England. Journal of Applied Phycology, 2002, 14(1): 9-18. DOI:10.1023/A:1015236404305 |
 2015, Vol. 27

