(2: 中国科学院南京地理与湖泊研究所, 南京 210008)
(2: Nanjing Institute of Geography and Limnology, Chinese Academy of Sciences, Nanjing 210008, P. R. China)
伴随着我国经济的快速发展,大量污染物的产生和排放,致使许多湖泊和水库富营养化日趋严重.由于富营养化,太湖每年的5-10月都会出现大量的微囊藻水华,给太湖周边的社会生活和生产造成重大影响和损失[1-2].尽管大量科研人员对微囊藻水华进行研究,然而,到目前为止微囊藻水华暴发机理还不清楚.
在湖泊等自然水体中,微囊藻水华暴发时,大量微囊藻以群体状态漂浮在湖水表层[3-5].微囊藻群体的大小对微囊藻在水中的迁移速度[6-7]、抗捕食压力[8]和比表面积有重要的影响. Wu等[9]发现太湖微囊藻水华暴发时,因为微囊藻大群体更容易克服湖水扰动产生的包裹力,同时对太阳辐射的昼夜变化反应不敏感,所以无论是在有风和无风的情况,大于120 μm的微囊藻大群体总是聚集于湖水表层.
在野外条件下,微囊藻主要以群体形态存在[3],而转入室内培养后主要以单细胞和2细胞形态为主[10-11].微囊藻单细胞如何转变为群体这一问题引起了很多关注.有研究显示,很多因素都可以诱导微囊藻单细胞形成群体,包括生物因子,如鞭毛虫的摄食[3, 12-14]、后生浮游动物摄食[15]、异养菌的诱导作用[16];化学因子,如微囊藻毒素[17];物理因子,如高光照强度[18].尽管有关微囊藻单细胞转变为群体的研究已经取得了很多进展,然而到目前为止,其机理还不是很清楚.
微囊藻大群体一般通过小群体生长而来.影响微囊藻群体生长的因素有很多,包括浮游动物捕食等生物因素以及营养盐[19]、光照[20]、温度等非生物因素.除生长方式以外,周健[21]研究发现室内扰动可促使单一种微囊藻小群体短时间内聚集成大群体.在自然条件下扰动是否也会使野外微囊藻群体增大?然而到目前为止,国内外有关扰动对野外微囊藻群体大小的影响研究鲜见报道[22-23].本研究通过野外模拟扰动实验,比较了扰动前、后太湖野外微囊藻群体大小的变化,将有助于人们对太湖微囊藻水华暴发机理的认识.
1 材料与方法2014年7月用水泵抽取太湖梅梁湾湖水至圆柱形塑料大桶(直径为90 cm,高为80 cm)中,使所有桶中湖水高度都为60 cm,对照组和实验组各3个平行,共6个水桶.水桶放置在中国科学院太湖湖泊生态系统研究站码头旁边的平地上,测定水桶中水样的总氮(TN)和总磷(TP)浓度,然后添加氮、磷使所有水桶中水的TN=5 mg/L,TP=0.25 mg/L(太湖梅梁湾20002008年TN、TP平均值的2倍,其中TN和TP分别用NaNO3和K2HPO4·3H2O来配制),然后静置培养5 d.实验期间每天固定时间(上午10:00)采集上、下2个水层(0和50 cm深度)水样.静止培养期间每天测定微囊藻群体大小和叶绿素a浓度(Chl.a).
实验第6 d,对照组不扰动,实验组使用造浪泵(WP-60,中山市捷宝电子电器有限公司生产)模拟风浪连续扰动24 h(W1、S2档,频率1次/s,造浪泵放置于表面水下10 cm,获得水平方向的波浪,浪高约5 cm).扰动期间第3、6、12、24 h和扰动结束后第0、3、6、12、24、48 h分别取水样测定微囊藻群体大小和Chl.a.整个实验周期共9 d.扰动前后分别测定对照组和实验组微囊藻胞外多糖含量.其中,取水样500 ml用不同的滤网(48和96 μm)进行过滤,并测定不同大小微囊藻群体(<48、48~96和>96 μm)的Chl.a浓度,另取水样500 ml然后立即加入1%鲁哥试剂固定保存,回实验室静置48 h,然后定容至50 ml.在显微镜下(Nikon E100和QCapture pro软件)每个样品随机测定100个微囊藻群体大小,然后取平均值,从而获得微囊藻群体平均大小.同时测定微囊藻细胞数量和总浮游植物数量.水样TN、TP和Chl.a浓度参照文献[24]测定.胞外多糖含量采用蒽酮硫酸法[25]测定.经镜检,整个实验期间实验组和对照组水样中微囊藻数量占浮游植物总数量的比例均大于90%,所以本实验用Chl.a浓度代表微囊藻生物量.测定获得湖水抽取后实验组初始状态的微囊藻群体粒径为45.4 μm,对照组为46.7 μm;实验组初始状态叶绿素a浓度为35.8 μg/L,对照组为36.6 μg/L.
对照组和实验组微囊藻群体大小、Chl.a、胞外多糖含量等指标差异采用SPSS 19.0软件单因素方差法进行统计分析.
2 结果 2.1 微囊藻群体大小变化扰动前实验组和对照组微囊藻群体大小均逐渐减小,到实验第6 d时,实验组微囊藻群体大小由45.4 μm减小到20.19 μm,对照组微囊藻群体大小由46.75 μm减小为19.76 μm(图 1),方差分析显示扰动前6 d对照组和实验组微囊藻群体大小没有显著差异(P>0.05).实验组在第6 d开始扰动,对照组不扰动,保持静置,实验组在扰动24 h结束时,微囊藻群体大小迅速增大为68.38 μm,为扰动前微囊藻群体大小的3.38倍,并且在扰动结束后的12 h内继续增大,微囊藻群体达到76.54 μm,之后又逐渐变小,到实验结束时,微囊藻群体大小平均为70.11 μm,是扰动前的3.47倍.而对照组在扰动24 h结束时,微囊藻群体大小为12.56 μm,实验组与对照组微囊藻群体大小呈极显著差异(P<0.01);对照组微囊藻群体大小在实验过程中持续变小,到实验结束时仅为10.08 μm,微囊藻大群体基本消失.方差分析显示从扰动到实验结束3 d内对照组和实验组微囊藻群体大小呈极显著差异(P<0.01).

|
图 1 实验过程中微囊藻群体大小变化 Fig.1 Variation of the sizes of Microcystis colonies during the experiment |
实验过程中,对照组和实验组微囊藻类生物量(Chl.a浓度)均稳定增加,实验结束时2组Chl.a浓度较实验第1 d分别增加了1.34和1.67倍,对照组的相对生长速率为0.201 μg/(L·d),实验组的相对生长速率为0.247 μg/(L·d),二者没有显著差异(P>0.05).
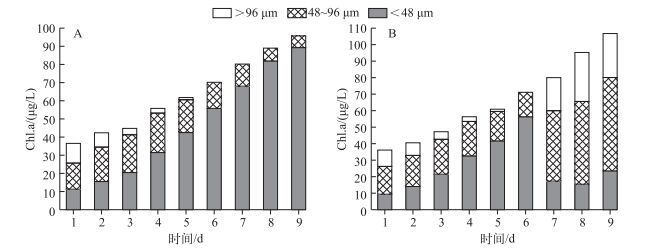
实验过程中,对照组和实验组微囊藻群体大小组成随时间不断变化.整个实验期间,对照组<48 μm微囊藻群体Chl.a浓度不断增加,相反>48 μm微囊藻群体Chl.a浓度不断减小,>48 μm微囊藻群体Chl.a浓度从实验开始所占比例为69.67%,到实验结束时仅占6.91%,其Chl.a浓度为79.56 μg/L(图 2A).实验组中,扰动前>48 μm微囊藻群体Chl.a浓度在实验过程中随时间逐渐降低,实验第6 d Chl.a浓度为14.58 μg/L;经过24 h模拟风浪扰动后,实验第7 d模拟风浪扰动结束时,>48 μm微囊藻群体Chl.a浓度迅速增加了3.3倍,Chl.a浓度为62.69 μg/L,极显著高于对照组中>48 μm微囊藻群体Chl.a浓度(P<0.01),实验组中<48 μm微囊藻群体Chl.a浓度由54.62 μg/L急剧减少到17.62 μg/L.

|
图 2 实验过程中不同大小微囊藻群体Chl.a浓度的变化(A:对照组,B:实验组) Fig.2 Chl.a concentrations of different size of Microcystis colonies during the experiment(A:Control, B: Treatment) |
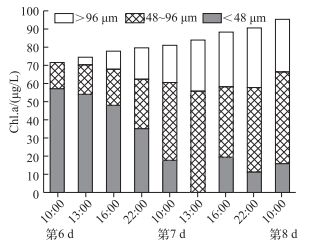
实验开始时,>96 μm和48~96 μm大群体微囊藻群体所占比例分别为27.99%和43.94%,实验第6 d,其比例分别下降为0.48%和20.59%;但在模拟风浪扰动24 h之后,其比例分别急剧上升至25.59%和52.49%;实验结束时>96 μm和48~96 μm大群体所占其比例分别为26.73%和55.71%(图 2B).为了更清楚地了解微囊藻群体的变化规律,在扰动过程中及扰动后增加了采样频率,图 3显示随着模拟风浪扰动的进行,小群体逐渐聚集成大群体,并且这种群体状态在扰动停止后的24 h内可以维持相对稳定.

|
图 3 实验组扰动期间及扰动后24 h内不同大小微囊藻群体Chl.a浓度变化 Fig.3 Chl.a concentration variation of different sizes of Microcystis colonies in treatments during mixing and after mixing for 24 h |
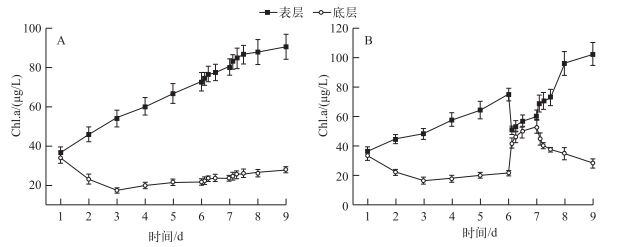
湖水最初被抽到大桶中时,湖水是充分混合的,表层和底层中Chl.a浓度分别为36.82和33.40 μg/L,二者无显著性差异(P>0.05).在扰动前的静置阶段,水中的微囊藻群体在浮力作用下上升,表层Chl.a浓度上升、底层Chl.a浓度降低,到实验第6 d上午10:00扰动开始时,表层Chl.a浓度为75.2 μg/L,而底层Chl.a浓度仅为21.96 μg/L.模拟风浪扰动期间,扰动促进了水体混合,表层Chl.a浓度急剧下降为51.17 μg/L、底层Chl.a浓度迅速上升为42.12 μg/L(图 4).扰动期间,表层水体与底层水体中Chl.a浓度差异不显著(P>0.05),微囊藻在整个水柱中不存在明显的分层现象.在扰动结束后的静止阶段,表层Chl.a浓度逐渐增加,底层Chl.a浓度逐渐降低,实验结束时,微囊藻主要分布在水桶中水的表层,其Chl.a浓度为102.63 μg/L,而底层只有28.63 μg/L,表层和底层Chl.a浓度具有显著差异(P<0.05),分层现象重新出现(图 4).

|
图 4 实验过程中表层和底层Chl.a浓度变化(A:对照组,B:实验组) Fig.4 Concentration variation of Chl.a at surface and bottom of water during the experiment (A: Control, B: Treatment) |
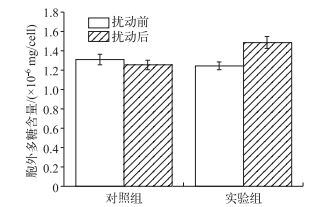
扰动前对照组与实验组胞外多糖含量差异不显著(P>0.05),连续扰动24 h后,对照组胞外多糖含量由1.31×10⁻⁶ mg/cell降低到1.26×10-6 mg/cell,差异不显著(P>0.05);实验组胞外多糖含量则由扰动前的1.25×10-6 mg/cell增加到1.49×10-6 mg/cell,差异显著(P<0.05);扰动结束后实验组和对照组胞外多糖含量具有显著差异(P<0.05)(图 5).这说明除自然生长外,扰动促进了微囊藻胞外多糖的合成,这可能是因为扰动作用对微囊藻细胞产生刺激,诱导藻细胞产生更多的胞外多聚糖,从而提高细胞的黏性,有利于扰动过程中微囊藻群体的聚集变大.

|
图 5 实验组和对照组微囊藻群体胞外多糖含量 Fig.5 Extracellular polysaccharides contents of Microcystis colonies in controls and treatments |
在野外模拟条件下,短时间(24 h)连续扰动作用能促使太湖微囊藻小群体快速形成大群体.目前国内外关于水动力扰动对微囊藻群体的影响研究很少.周健[21]研究发现室内扰动可促使单一种微囊藻小群体细胞短时间内聚集成大群体, 这与本研究结果一致. O'Brien等[22]报道采自野外的混合微囊藻群体扰动后发生解离,解离后的微囊藻群体大小主要为220~420 μm. Robarts等[23]报道大群体微囊藻在很小的扰动下会解离成小群体.微囊藻群体扰动后是聚集还是解离与扰动强度有关.周健[21]研究报道室内条件下在一定扰动强度下(50~150转/min)有利于群体聚集,当扰动强度过大时(>200转/min)不利于群体聚集.实验中采用的扰动强度不同可能是导致本研究结果与以上研究结果不同的原因之一.
本研究结果显示,扰动后实验组微囊藻胞外多糖含量显著高于对照组(P<0.05).研究证实,环境的变化几乎会对所有有机体的显型产生影响[26-27],微囊藻细胞同样具有表型可塑性,微囊藻细胞聚集成群体的现象可能是微囊藻应对外界环境改变的一种方式.藻类群体中各细胞的聚集主要依靠的是具有黏性的胞外多聚糖,因此,浮游植物群体的形成与胞外多聚糖含量有着直接的关系[28-31].阳振[18]研究发现铜绿微囊藻群体形成后胞外多聚糖含量要显著高于单细胞胞外多聚糖含量.大量研究表明,细胞胞外多糖的分泌与生物和非生物因子(如:光照、营养盐和温度等)有重要关系. Yang等[32]发现原生动物的强牧食压力下铜绿微囊藻胞外多聚糖分泌量明显增加.鱼腥藻的胞外多聚糖的释放受到温度的影响[33]. De Philippis等[28]研究发现N限制条件下能促进蓝藻体内胞外多糖的合成,而在P饥饿或P缺乏时,一些藻类的多聚糖含量也会升高[34-35].有研究表明,水动力扰动可以加速营养盐的传递速率,提高细胞对营养盐的吸收速率[36]. Zhou等研究发现,短期(6 d)的水动力扰动提高了浮游植物的碱性磷酸酶活性,有利于浮游植物的生长[37].本研究也发现扰动组细胞胞外多糖含量显著高于对照组.水体扰动增加了微囊藻细胞之间的碰撞概率,黏性的胞外多糖有助于微囊藻细胞之间发生黏合,从而形成微囊藻大群体.扰动引起微囊藻胞外多糖含量增加可能是本研究中微囊藻小群体聚集成微囊藻大群体的主要原因.
太湖风浪扰动频繁,其强度随时间而变化.可以推测,在太湖夏季和秋季,适当强度的风浪扰动会促使太湖微囊藻小群体短时间内形成大群体,由于微囊藻大群体有较快的上浮速度[38],所以当风浪扰动变小后,微囊藻大群体就会快速上浮至湖水表层,当微囊藻大群体数量足够多时便会形成微囊藻水华.所以,该研究结果将有助于人们对太湖微囊藻水华暴发机理的认识.
| [1] |
Chen YW, Qin BQ, Teubner K et al. Long-term dynamics of phytoplankton assemblages, Microcystis domination in Lake Taihu, a large shallow lake in China. Journal of Plankton Research, 2003, 25(4): 445-453. DOI:10.1093/plankt/25.4.445 |
| [2] |
Qin BQ, Xu PZ, Wu QL et al. Environmental issues of Lake Taihu, China. Hydrobiology, 2007, 581(1): 3-14. DOI:10.1007/s10750-006-0521-5 |
| [3] |
Burkert U, Hyenstrand P, Drakare S et al. Effects of the mixotrophic Flagellate Ochromonas sp. on colony formation in Microcystis aeruginosa. Aquantic Ecology, 2001, 35(1): 11-17. DOI:10.1023/A:1011454313607 |
| [4] |
Li YG, Gao KS. Photosynthetic physiology and growth as a function of colony size in the cyanobacterium Nostoc sphaeroides. European Journal of Phycology, 2004, 39(1): 9-15. DOI:10.1080/0967026032000157147 |
| [5] |
Wallace, Brett B. Simulation of water-bloom formation in the cyanobacterium Microcystis aeruginosa. Journal of Plankton Research, 2000, 22(6): 1127-1138. DOI:10.1093/plankt/22.6.1127 |
| [6] |
Hutchinson GE. A treatise on limnology. New York: Wiley, 1975.
|
| [7] |
Reynolds CS. The Ecology of freshwater phytoplankton. Cambridge: Cambridge University Press, 1984.
|
| [8] |
Oliver RL, Ganf GG. Freshwater blooms. Dordrecht: Kluwer Academic Publishers, 2000, 149-194.
|
| [9] |
Wu XD, Kong FX. Effects of light and wind speed on the vertical distribution of Microcystis aeruginosa colonies of different sizes during a summer bloom. International Review of Hydrobiology, 2009, 94(3): 258-266. DOI:10.1002/iroh.200811141 |
| [10] |
Reynolds CS, Jaworski GHM, Cmiech HA et al. On the annual cycle of the blue-green alga Microcystis aeruginosa Kütz. Philosophical Transactions of the Royal Society of London B-Biological Science, 1981, 293: 419-477. DOI:10.1098/rstb.1981.0081 |
| [11] |
Bolch CJ, Blackburn SI. Isolation and purification of Australian isolates of the toxic cyanobacterium Microcystis aeruginosa Kütz. Journal of Applied Phycology, 1996, 8: 5-13. DOI:10.1007/BF02186215 |
| [12] |
Yang Z, Kong FX, Shi XL et al. Changes in the morphology and polysaccharide content of Microcystis aeruginosa (Cyanobacteria) during flagellate grazing. Journal of Phycology, 2008, 44: 716-720. DOI:10.1111/j.1529-8817.2008.00502.x |
| [13] |
Wu Zhongxing. Studies on the genetic diversity and morphological and physiological adaptation of Microcystis[Dissertation]. Wuhan:Institute of Hydrobiology, Chinese Academy of Sciences, 2006. [吴忠兴. 我国微囊藻多样性分析及其种群优势的生理学机制研究[学位论文]. 武汉: 中国科学院水生生物研究所, 2006. http://cdmd.cnki.com.cn/Article/CDMD-80119-2006130501.htm ]
|
| [14] |
Yang Z, Kong FX, Yang Z et al. Effect of filtered cultures of Flagellate Ochromonas sp. on colony formation in Microcystis aeruginosa. International Review of Hydrobiology, 2009, 94(2): 143-152. DOI:10.1002/iroh.200811103 |
| [15] |
Jang MH, Ha K, Joo GJ et al. Toxin production of cyanobacteria is increased by exposure to zooplankton. Freshwater Biology, 2003, 48: 1540-1550. DOI:10.1046/j.1365-2427.2003.01107.x |
| [16] |
Shen H, Niu Y, Xie P et al. Morphological and physiological changes in Microcystis aeruginosa as a result of interactions with heterotrophic bacteria. Freshwater Biology, 2011, 56(6): 1065-1080. DOI:10.1111/j.1365-2427.2010.02551.x |
| [17] |
Sedmak B, Eleršek T. Microcystins induce morphological and physiological changes in selected representative phytoplanktons. Microbial Ecology, 2005, 50: 298-305. DOI:10.1007/s00248-004-0189-1 |
| [18] |
Yang Zhen. Study on the driving factors of colony formation in Microcystis[Dissertation]. Nanjing:Nanjing Institute of Geography and Limnology, Chinese Academy of Sciences, 2010. [阳振. 微囊藻群体形成的驱动因子研究[学位论文]. 南京: 中国科学院南京地理与湖泊研究所, 2010. ]
|
| [19] |
Xu Huiping, Yang Guijun, Zhou Jian et al. Effect of nitrogen and phosphorous concentration on colony growth of Microcystis flos-aquae in Lake Taihu. J Lake Sci, 2014, 26(2): 213-220. [许慧萍, 杨桂军, 周健等. 氮、磷浓度对太湖水华微囊藻(Microcystis flos-aquae)群体生长的影响. 湖泊科学, 2014, 26(2): 213-220. DOI:10.18307/2014.0207] |
| [20] |
Zhang Yanqing, Yang Guijun, Qin Boqiang et al. Effect of light intensity on growth of Microcystis flos-aquae colonies size. J Lake Sci, 2014, 26(4): 559-566. [张艳晴, 杨桂军, 秦伯强等. 光照强度对水华微囊藻群体大小增长的影响研究. 湖泊科学, 2014, 26(4): 559-566. DOI:10.18307/2014.0410] |
| [21] |
Zhou Jian. Effect of disturbance on colony of Microcystis in Lake Taihu[Dissertation]. Wuxi:Jiangnan University, 2013. [周健. 扰动对太湖微囊藻群体的影响研究[学位论文]. 无锡: 江南大学, 2013. ]
|
| [22] |
O'Brien KR, Meyer DL, Waite AW et al. Disaggregation of Microcystis aeruginosa colonies under turbulent mixing:Laboratory experiments in a grid-stirred tank. Hydrobiologia, 2004, 519: 143-152. DOI:10.1023/B:HYDR.0000026501.02125.cf |
| [23] |
Robarts RD, Zohary T. Microcystis aeruginosa and underwater light attenuation in a hypertrophic lake (Hartbeesport Dam, South Africa). Journal of Ecology, 1984, 72: 1001-1017. DOI:10.2307/2259547 |
| [24] |
Jin Xiangcan, Tu Qingying. Investigation standards of lake eutrophication. Beijing: China Environmental Science Press, 1990. [金相灿, 屠清瑛. 湖泊富营养化调查规范. 北京: 中国环境科学出版社, 1990.]
|
| [25] |
Zhou Y, Liu Y, Ge J et al. Aggregate formation and polysaccharide content of Chlorella pyrenoidosa Chick (Chlorophyta) in response to simulated nutrient stress. Bioresource Technology, 2010, 101: 8336-8341. DOI:10.1016/j.biortech.2010.06.022 |
| [26] |
Waddington CH. Genetic assimilation of an acquired character. Evolution, 1953, 7(2): 118-126. DOI:10.2307/2405747 |
| [27] |
Bradshaw AD. Evolutionary significance of phenotypic plasticity in plants. Advances in Genomics and Genetics, 1965, 13: 115-155. DOI:10.1016/S0065-2660(08)60048-6 |
| [28] |
De Philippis R, Margheri MC, Pelosi E et al. Exopolysaccharide production by a unicellular cyanobacterium isolated from a hypersaline habitat. Journal of Applied Phycology, 1993, 5(4): 387-394. DOI:10.1007/BF02182731 |
| [29] |
Wustman BA, Gretz MR, Hoagland KD. Extracellular matrix assembly in diatoms(Bacillariophyceae). I. A model of adhesives based on chemical characterization and localization of polysaccharides from the marine diatom Achnanthes longipes and other diatoms. Plant Physiology, 1997, 113(4): 1059-1069. DOI:10.1104/pp.113.4.1059 |
| [30] |
Van RM, Janse I, Noordkamp DJB et al. An inventory of factors that effect polysaccharide production by Phaeocystis globosa. Journal of Sea Research, 2000, 43: 297-306. DOI:10.1016/S1385-1101(00)00013-7 |
| [31] |
Thornton D. Diatom aggregation in the sea:Mechanisms and ecological. European Journal of Phycology, 2002, 37: 149-161. DOI:10.1017/S0967026202003657 |
| [32] |
Yang Z, Kong F, Shi X et al. Changs in the morphology and polysaccharide content of Microcystis aeruginosa (Cyanobacteria) during flagellate grazing. Journal of Phycology, 2008, 44: 716-720. DOI:10.1111/j.1529-8817.2008.00502.x |
| [33] |
Moreno J, Vargas MA, Olivares H et al. Exopolysaccharide production by the cyanobacterium Anabaena sp. ATCC 33047 in batch and continuous culture. Journal of Biotechnology, 1998, 60: 175-182. DOI:10.1016/S0168-1656(98)00003-0 |
| [34] |
Nicolaus B, Panico A, Lama L et al. Chemical composition and production of exopolysaccharides from representative members of heterocystous and non-heterocystous cyanobacteria. Phytochemistry, 1999, 52(4): 639-647. DOI:10.1016/S0031-9422(99)00202-2 |
| [35] |
Roux JM. Production of polysaccharide slime by microbial mats in the hypersaline environment of a Western Australian solar saltfield. International Journal of Salt Lake Research, 1996, 5(2): 103-130. DOI:10.1007/BF01995826 |
| [36] |
Prairie JC, Sutherland KR, Nickols KJ et al. Biophysical interactions in the plankton:A cross-scale review. Limnology & Oceanography:Fluids & Environments, 2012, 2: 121-145. DOI:10.1215/21573689-1964713 |
| [37] |
Zhou J, Qin B, Casenave C et al. Effects of turbulence on alkaline phosphatase activity of phytoplankton and bacterioplankton in Lake Taihu. Hydrobiologia, 2016, 765(1): 197-207. DOI:10.1007/s10750-015-2413-z |
| [38] |
Xiao Y, Gan NQ, Liu J et al. Heterogeneity of buoyancy in response to light between two buoyant types of cyanobacterium Microcystis. Hydrobiologia, 2012, 679: 297-311. DOI:10.1007/s10750-011-0894-y |
 2017, Vol. 29
