(2: 南京信息工程大学应用气象学院, 南京 210044)
(3: 南京信息工程大学大气科学学院, 南京 210044)
(2: College of Applied Meteorology, Nanjing University of Information Science and Technology, Nanjing 210044, P. R. China)
(3: College of Atmospheric Science, Nanjing University of Information Science and Technology, Nanjing 210044, P. R. China)
我国内陆湖泊约占国土面积的0.9 % [1], 虽然所占比例不大, 但研究湖泊小时尺度水面蒸发的社会价值和科学意义因人类依水而居而凸显.首先, 作为大气水汽的重要来源, 大型湖泊小时尺度水面蒸发能影响成云过程, 增强下游降水[2-3].同时, 小时尺度水面蒸发是湖泊水分循环和能量平衡的关键环节, 与陆地蒸散昼强夜弱变化特征不同, 夜间湖泊水面蒸发约占全年蒸发的48 % [4].此外, 小时尺度水面蒸发会改变湖面大气边界层(Atmospheric boundary layer, ABL)的热力和动力结构[5], 激发诸如湖陆风等局地环流, 进而影响流域内大气污染物的扩散与传输[6-7].因此, 研究小时尺度水面蒸发特征对改善流域高时间分辨率的天气、空气质量预报和精准利用水资源意义重大.
目前, 国外已有研究利用涡度相关技术(Eddy covariance, EC)直接观测湖泊潜热通量[8-11], 或采用大孔径闪烁仪(Large aperture scintillometer, LAS)[12-13]基于能量平衡方程估算潜热通量.研究发现, 湖泊潜热通量日变化幅度不明显, 最大值出现在下午而非太阳辐射最强的正午, 最小值出现在午夜[5, 14-15], 得益于水体热储量释放, 夜间水面蒸发显著[14-16].从影响因素而言, 影响小时尺度水面蒸发特征的主因并非净辐射(Rn)[10, 15, 17-22], 而是水气界面的水汽压差(Δe)[23-25]或风速(u)[17, 20], 且发现潜热通量(LE)与两者乘积uΔe的相关性比与u或Δe各自的相关性更强, 即小时尺度水面蒸发很大程度上取决于u与Δe的协同作用[21].基于EC技术, 国内研究者也在太湖、鄂陵湖、洱海、纳木错和鄱阳湖开展了高时间分辨率的湖泊潜热通量观测[26-28], 但对湖泊各季节和全年小时尺度水面蒸发特征及其影响因素的研究尚需深入.
尽管EC和LAS观测有助于理解水气间潜热通量交换特征及其影响机制, 但昂贵的设备和复杂的操作限制了此类观测技术的推广[19], 故模拟湖泊蒸发过程很有必要[29-30].已有研究评估了湖泊蒸发模型的模拟效果[10, 31-33], 但大多数模型(如彭曼模型、温度—日长模型)局限于对日或更长时间尺度水面蒸发的模拟, 仅有少数模型可用于模拟小时尺度水面蒸发, 如传统质量传输模型、Granger and Hedstrom经验模型和DYRESM (Dynamic Reservoir Simulation Model)水文模型. McGloin等[34]分析了这3个模型模拟小型水库小时尺度水面蒸发的效果, 但对于大型湖泊(如太湖)的模拟效果有待评估.随着公众对天气预报和气候预测需求的加强, 数值预报模式和气候模型将趋于机理综合化和尺度精细化[35], 这需要对小于日尺度的水面与大气之间的潜热交换过程进行准确参数化[34], 亟待加强小时尺度水面蒸发模型的评估.
本文旨在利用太湖涡度相关通量、辐射和气象观测资料, 分析太湖小时尺度水面蒸发特征及其影响因素, 选取传统质量传输模型、Granger and Hedstrom经验模型和DYRESM模型模拟太湖小时尺度水面蒸发, 并利用EC实测潜热通量评估各模型的模拟效果, 探讨其误差来源, 最终得到适用于模拟太湖小时尺度水面蒸发的模型.
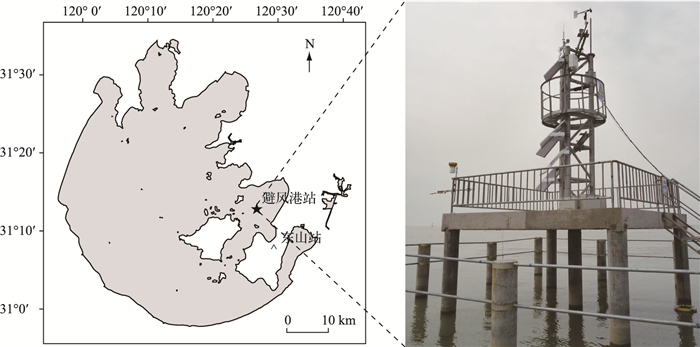
1 资料与方法 1.1 研究站点太湖是我国第三大淡水湖, 水面面积为2400 km2, 平均深度为1.9 m, 为典型的亚热带大型浅水湖泊.研究站点为太湖东部的湖泊通量观测站——避风港站(BFG站)(31°10′N, 120°24′E)(图 1), 该站观测始于2011年12月15日, 本文所用数据是2012年1月1日0:00至2013年2月28日24:00的BFG站半小时通量、辐射和小气候观测数据, 基于2012年数据进行全年分析, 冬季分析基于2012 2013跨年数据. BFG站水域清澈[36]且有沉水植物(以马来眼子菜(Potamogeton malaianus)和轮叶黑藻(Hydrilla verticillata)为主)生长[4], 四周水域开阔, 风浪区均超过4 km, 2 m高度年平均风速为4.0 m/s[15].

|
图 1 太湖湖泊通量观测站——避风港站、陆地气象站——东山站地理位置示意图及避风港站平台照片 Fig.1 Map showing a lake flux site in Lake Taihu (Bifenggang station) and Dongshan land meteorology station; The instrument platform photo of the Bifenggang station is also shown |
BFG站装有涡度相关(EC)观测系统、四分量净辐射传感器、小气候观测系统和水温梯度观测系统各一套[15], 观测设备均安装在4 m×4 m的观测平台上.
EC观测系统由三维超声风速计(CSAT3, Campbell Scientific Inc.)和开路式红外气体分析仪(EC150, Campbell Scientific Inc.)组成, 以10 Hz频率分别测量三维风速/超声温度和大气中水汽、CO2密度, 该系统安装在离水面8.5 m(安装时)的高度处.数据采集器(CR3000, Campbell Scientific Inc.)基于10 Hz观测数据在线计算30 min平均动量、感热、潜热和CO2通量.为保证EC系统正常运行及观测数据的准确性, 红外气体分析仪在实验前进行一次室内标定, 野外观测时每季度进行一次场外标定.四分量净辐射传感器(CNR4, Kipp & Zonen B.V.)用于测量太阳向下短波、反射短波、向下长波和向上长波辐射, 安装高度距离水面2 m(安装时).小气候观测系统由温湿度传感器(HMP155A, Vaisala Inc.)和风速风向传感器(05103, R.M. Young Company)构成, 其观测高度与EC相同, 用于测量空气温度、湿度、风速和风向.降水量由自动翻筒式雨量计(TE525-L, Campbell Scientific Inc.)测得. BFG站水温梯度观测(109-L, Campbell Scientific Inc.)分为水下20、50、100、150 cm 4个梯度, 并用相同的温度传感器观测湖泊底泥温度[4].
1.3 数据处理过程本文对30 min平均通量数据进行的后处理包括:两次坐标旋转[37]、超声虚温订正、密度响应校正(WPL校正)[38-39]和数据质量控制.
首先, 基于三维风速数据, 通过两次坐标旋转将超声风速的笛卡尔坐标系转换成自然风坐标系[40], 使半小时平均水平风与x轴平行, 平均侧风速度和平均垂直风速皆为零.其次, 为弥补湿度脉动对超声温度测量的影响, 基于通量数据和空气温度对感热通量H进行超声虚温订正[41-42].再次, 考虑到热量和水汽输送引起的空气密度脉动, 需对潜热通量LE进行WPL校正[39, 43].最后, 剔除降水时刻的EC通量观测数据, 基于辐射和小气候观测, 利用阈值法和滑动平均标准差法剔除潜热通量异常值并进行数据质量控制.
1.4 小时尺度水面蒸发模型 1.4.1 传统质量传输模型该模型[34]依据水面与空气之间的湿度差、风速和水汽传输系数来确定水面蒸发, 具体表达式如下:
| $ E = {C_{\rm{E}}} \cdot \rho \cdot u\left( {{q_{\rm{s}}}-{q_{\rm{a}}}} \right) $ | (1) |
式中, E为水面蒸发量(kg·m2/s);ρ为空气密度(kg/m3);qs为水面温度(Ts)所对应的饱和比湿(kg/kg);qa为空气比湿(kg/kg);u为10 m高度处风速(m/s), 可依据风廓线对数规律由风速测量值计算得到;CE为标准高度10 m对应的水汽传输系数, Xiao等[44]综合考虑了太湖BFG站沉水植物、风速等对水汽传输系数的影响, 并进行了大气稳定度校正, 确定BFG站的CE为1.0×10⁻³.
基于Stefan-Boltzmann定律, 利用长波辐射观测值计算得到水面温度Ts(K), 即:
| $ {T_{\rm{s}}} =-{\left( {\frac{{{L_ \uparrow }-\left( {1-\varepsilon } \right){L_ \downarrow }}}{{\varepsilon \sigma }}} \right)^{1/4}} $ | (2) |
式中, L↑和L↓分别为四分量净辐射传感器所观测的向上和向下长波辐射(W/m2);ε为水面比辐射率, 为0.97[45-46];σ是Stefan-Boltzmann常数, 取值为5.67×10⁻⁸ W/(m2·K4).
水面蒸发量E乘以汽化潜热L(J/kg)即可转换为潜热通量(LE)(W/m2), 汽化潜热(L)根据空气温度(Ta, K)通过下式算得:
| $ L = \left( {2.501-0.002361\left( {{T_{\rm{a}}}-273.15} \right)} \right) \times {10^6} $ | (3) |
Granger and Hedstrom[19]提出了一种用于估计湖泊小时尺度LE的简单经验模型, 具体如下:
| $ LE = \left[{b + m\left( {{T_{\rm{a}}}-{T_{\rm{s}}}} \right) + n\left( {{e_{{\rm{sw}}}}-{e_{\rm{a}}}} \right)} \right]{u_2} $ | (4) |
式中, u2是2 m高度处风速(m/s);esw为水面温度Ts所对应的饱和水汽压(hPa);ea是空气水汽压(hPa);Ta和Ts含义同上.该模型考虑了大气稳定度对水面蒸发的影响, 大气稳定时(Ta>Ts), 湖泊蒸发受到抑制;大气不稳定时(Ta<Ts), 大气条件可促进水面蒸发[19], 故系数b、m、n需在不同的大气稳定度下分别计算:
大气稳定时:
| $ \left\{ \begin{array}{l} b = 3.395 + 0.008X\\ m =-4.584 + 0.420\;\ln \;X\\ n = 20.256-0.0011X \end{array} \right. $ | (5) |
大气不稳定时:
| $ \left\{ \begin{array}{l} b = 2.373 + 0.002X\\ m =-1.758 + 0.0904\;\ln \;X\\ n = 26.525-0.0008X \end{array} \right. $ | (6) |
式中, X(m)为风浪区长度, 本文取4000 m.
1.4.3 DYRESM模型DYRESM是一维水文模型, 当湖泊或水库满足一维假设, 即水体层结较明显时, 该模型可用于模拟小于日时间尺度的水体温度、盐度和密度的垂直分布[47-48]. DYRESM模型无需水面温度作为初始值输入, 其计算潜热通量的方法为[48]:
| $ {Q_{{\rm{lh}}}} = \min \left[{0, \frac{{0.622}}{P}{C_{\rm{E}}} \cdot \rho \cdot L \cdot u\left( {{e_{{\rm{sw}}}}-{e_{\rm{a}}}} \right)\Delta t} \right] $ | (7) |
式中, Qlh为Δt时间段内水面蒸发所对应的热量(J/m2);水汽传输系数CE为1.3×10-3;汽化潜热L取2.453×106 J/kg;其他变量同上.
2 结果与讨论 2.1 小时尺度太湖水面蒸发的影响因素水面蒸发主要受三个环节控制:为蒸发提供多少可利用能量(净辐射), 维持蒸发进行的湿度梯度大小(水气界面水汽压差)以及水面与大气之间的水汽交换能力(风速和大气稳定度), 故合理的小时尺度水面蒸发模型应包含以上关键过程和主要影响因子.通过相关分析可知(表 1), 影响太湖LE最重要的环境单因子是水面与空气之间的水汽压差Δe(相关系数R=0.64), 其次是平均风速u(R=0.52), 且LE与Δe和u乘积的相关性更好(R=0.85).在小时尺度上, 净辐射Rn不是影响LE的重要因子(R=0.30), 这与净辐射和潜热通量日变化存在相位差异的结论一致[10, 15, 17-21, 44].尽管LE与水气界面温度差ΔT和uΔT的相关系数分别仅为0.05和0.18, 但ΔT会通过大气稳定度间接影响潜热交换[19], 不稳定大气边界层(ΔT>0)能促进湖泊潜热交换, 稳定大气边界层(ΔT<0)会抑制潜热蒸发[19-21, 49-51].四季潜热通量与环境因子的相关性与全年分析结果相似, LE与uΔe最相关, 其相关系数在春、夏、秋、冬季分别为0.85、0.78、0.88和0.87.冬季LE与uΔT、ΔT的相关系数(R=0.76, R=0.57)明显大于其他3个季节的结果, 尤其大于夏季结果(R=0.03, R=-0.04), 而冬季LE与Rn的相关系数(R=0.07)明显小于其它3个季节的结果, 尤其小于夏季结果(R=0.38), 这与冬、夏季的大气稳定度和辐射差异有关.
| 表 1 太湖避风港站潜热通量在半小时时间尺度上与环境因子的相关系数* Tab.1 The correlation coefficients between latent heat flux and environmental factors on the half-hour scale at the BFG station in Lake Taihu |
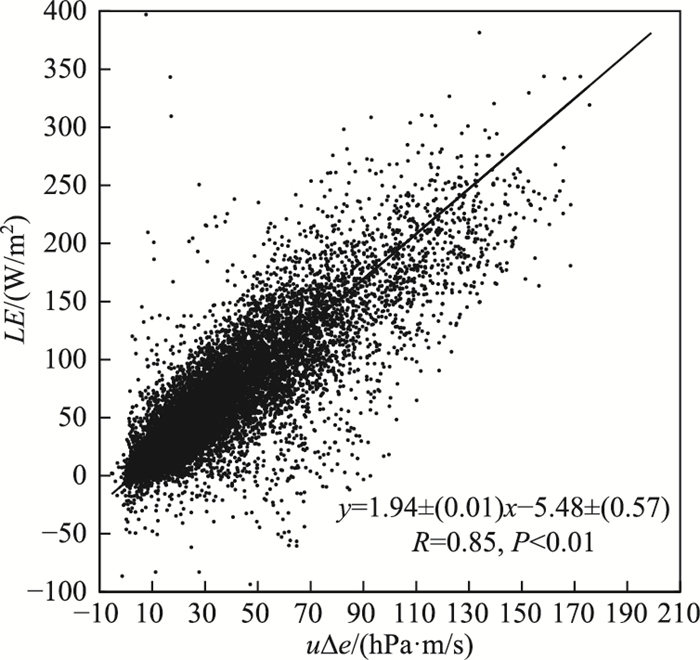
由于LE与uΔe均存在观测误差, 故本文采用几何平均回归方法(Geometric mean regression, GMR)[52]对BFG站的LE与uΔe进行线性回归(图 2), 回归方程为y=1.94(±0.01)x-5.48(±0.57), 相关系数R高达0.85, 即uΔe对LE变化的解释程度达到72 %.综合表 1和图 2可知, 影响太湖小时尺度水面蒸发最重要的因素是uΔe, 而其他环境因子的贡献在冬、夏两季存在差异, 冬季LE与uΔT相关性较强, 夏季LE和Rn存在一定的相关性.

|
图 2 涡度相关观测的LE与uΔe的几何平均回归关系 Fig.2 Geometric mean regression relationship between latent heat flux measured by eddy covariance and the product of wind speed and the vapor pressure difference at water-air interface |
从统计结果而言, 传统质量传输模型模拟结果的均值(61.37 W/m2)和中位数(47.57 W/m2)最接近于实测结果(均值为60.49 W/m2, 中位数为46.52 W/m2), Granger and Hedstrom和DYRESM模型模拟值的均值分别为84.28和79.83 W/m2, 中位数分别为68.56和61.58 W/m2, 均高于实测结果, 且以Granger and Hedstrom模型为甚.线性回归分析发现, 传统质量传输模型模拟的LE与EC LE的回归方程斜率为0.90, 表明该模型有低估太湖水面蒸发的趋势, 而Granger and Hedstrom和DYRESM模型模拟值与实测值的回归方程斜率分别为1.15和1.17, 表明这2个模型都系统性地高估太湖小时尺度水面蒸发.
本文选取相关系数(R)、均方根误差(RMSE)、Willmott一致性系数(I)、Nash-Sutcliffe效率(NSE)、平均误差(MBE)、平均绝对误差(MABE)、对称性平均绝对百分比误差(SMAPE)(公式见表 2)来综合评价3种模型对太湖小时尺度水面蒸发的模拟效果(表 3).传统质量传输模型模拟值与实测值的相关系数(R=0.86)、I(0.92)和NSE(0.73)均最大, 4个误差指标均最小, 即该模型模拟效果最佳, 这与BFG站LE与uΔe的强相关性(R=0.85)(见2.1节)有关, 诸多内陆水体EC观测都得到类似结论[21, 53]. Granger and Hedstrom模型模拟结果的误差指标最大, 如RMSE高达41.58 W/m2, 其模拟值与实测值相关系性最差(R=0.84)、I值最小(0.87)、NSE效率最低(0.41), 即该模型模拟值偏离实测值最大. DYRESM模型模拟效果的评价参数介于传统质量传输模型和Granger and Hedstrom模型之间, 模拟效果居中.

|
图 3 3种模型的LE模拟值与EC实测值的散点图和几何平均回归关系(EC为涡度相关观测, TM表示传统质量传输模型, GH表示Granger and Hedstrom模型, DR表示DYRESM模型) Fig.3 Scatter plots and geometric mean regression relationship between hourly latent heat flux measured by eddy covariance and simulated by three models(EC represents eddy covariance, TM represents traditional mass transfer model, GH represents Granger and Hedstrom empirical model, DR represents DYRESM model) |
| 表 2 太湖小时尺度水面蒸发模拟效果统计参数公式* Tab.2 Formulas of statistical parameters for evaluating simulation performance of hourly evaporation at Lake Taihu |
| 表 3 3种模型模拟太湖小时尺度水面蒸发效果的统计参数 Tab.3 Performance evaluation of hourly evaporation modelled by three models at Lake Taihu |
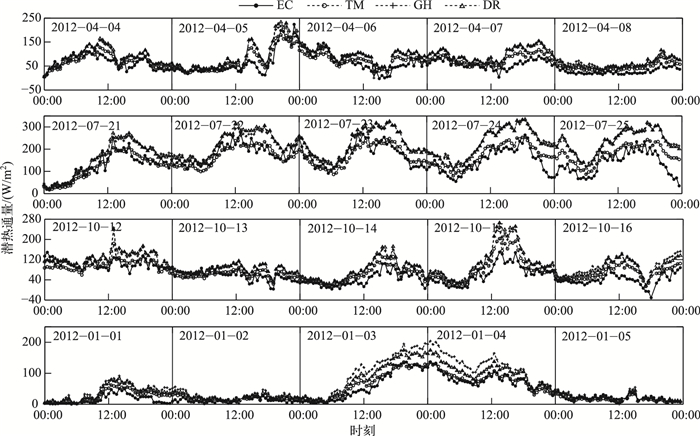
四季连续5日(1月1—5日、4月4—8日、7月21—25日和10月12—16日)潜热通量观测值和模拟值的时间序列见图 4. 7月连续5日潜热通量呈现显著的日变化特征, 即午后达到峰值、凌晨降至谷值, 其他各月5日潜热通量日动态并不明显, 而1月3—4日冷锋过境带来的大风降温天气能显著增强太湖水面蒸发.综合分析3个模型的模拟结果发现(表 3), 各模型在四季均能较好地模拟BFG站潜热通量时间变化特征, R均超过0.75, I均高于0.72. 3个模型模拟值的MABE和SMAPE最大值基本分别出现在7月和1月, 这与湖泊潜热通量夏季高冬季低的季节变化特征相关.对比分析3个模型模拟结果发现(表 3), 所有统计指标都显示传统质量传输模型在4个时段的模拟效果最佳, DYRESM模型次之, Granger and Hedstrom模型模拟误差最大. 3种模型模拟效果的对比差异在湖泊水面蒸发较大时更为明显(图 4), 如7月21—25日的午后时段和1月3—4日冷锋过境时, 且传统质量传输模型的优势在7月的连续5日更为突出, 其RMSE不足另外2个模型的1/6.

|
图 4 2012年1、4、7和10月连续5日潜热通量的涡度相关观测值和3种模型模拟值的时间序列图 Fig.4 Hourly time series of latent heat flux measured by eddy covariance and simulated by three models in 5 consecutive days during January, April, July and October in 2012 |
EC观测的LE季节平均和年平均日变化特征相似, 即在午后达到最大值, 凌晨达到最小值(图 4).年均日动态最大值为81.57 W/m2(14:00), 最小值为40.89 W/m2(5:30), 其日变化幅度(40 W/m2)明显小于太湖净辐射(460 W/m2)和东山站陆地潜热通量(130 W/m2)[4].冬季LE日变化较其他3个季节波动更明显, 可能与冬季冷锋频繁过境有关[22].太湖LE日变化与Rn存在相位差异, 通常较多的可利用能量(Rn-ΔQ, ΔQ为水体热储量)在午后主要用于潜热蒸发[10], 这一结论也被诸多研究所证实[5, 14-15].同时, 季节和年平均后的LE全天均为正值, 表明太湖湖面全天均发生蒸发, 与鄱阳湖EC观测结果类似[26].此外, 得益于水体热储量释放, 太湖夜间(19:00—7:30)蒸发显著, 约占全年蒸发总量的50 %, 与Liu等[22](49 %)和Li等[5](41 % ~51 %)的观测结果相近, 略高于McGloin等[14]的观测结果(40 %).
3个模型模拟的四季平均和年平均LE日变化趋势与EC实测值相近, 但模拟值的峰谷出现时间均落后于观测结果约0.5~1.5 h不等.春、冬季, 传统质量传输模型上午对潜热通量的低估比例分别为14 %和9 %, 下午分别高估15 %和10 %, 夜间模拟效果较好, 模拟误差不足3 %.该模型在夏季的模拟效果最好, 误差仅为3 %, 而在秋季模拟效果最差, 全天系统性地低估LE, 低估程度约为13 %. Granger and Hedstrom模型和DYRESM模型的模拟效果相近, 四季均系统性地高估LE日变化. Granger and Hedstrom模型在四季对LE的高估比例分别为48 %、38 %、18 %和72 %, 而DYRESM模型在四季的高估程度分别为38 %、35 %、12 %和35 %. Granger and Hedstrom模型在冬季的高估程度约为DYRESM模型的2倍, 与该模型在冬季高估大气稳定度对湖面蒸发的影响有关[34]. Granger and Hedstrom模型对上午水面蒸发的高估程度大于DYRESM模型, 下午两者高估程度相当.对于年平均日变化而言, 传统质量传输模型对LE日变化幅度模拟误差<1 W/m2, 夜间模拟值与实测值近乎相等, 仅在白天上午略微低估(6 %), 下午略微高估(4 %). Granger and Hedstrom模型对太湖年平均LE日变化的高估程度(38 %)大于DYRESM模型的高估程度(29 %), 午后2个模型高估程度相近, 上午和夜间DYRESM模型的高估偏差较Granger and Hedstrom模型小.
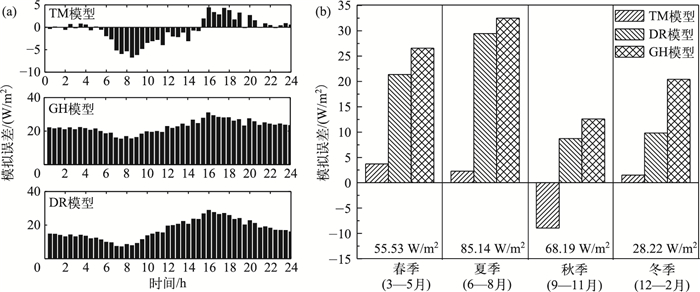
2.3 模型模拟误差分析 2.3.1 模型模拟误差的时间变化特征传统质量传输模型的LE模拟值在夜晚(21:00—5:30)与EC LE值一致性最佳;在6:00—15:00模拟值小于实测值, 且在上午(7:00—9:00)低估程度最大(5~7 W/m2);在15:30—20:30模拟值大于实测值, 日落前后(16:00—19:00)高估最明显(2~5 W/m2). Granger and Hedstrom模型和DYRESM模型模拟误差的日变化特征相似, 其模拟值始终大于LE观测值, 两者均在16:00左右高估程度最大, 上午8:00左右高估程度最小.具体而言, Granger and Hedstrom模型和DYRESM模型午后对LE高估值分别为22~32和20~29 W/m2, 上午高估程度分别为15~20和7~16 W/m2(图 5e和图 6a).

|
图 5 涡度相关观测和模型模拟的太湖潜热通量(a~d)季节平均和(e)年平均日变化(EC, TM, GH和DR含义同图 3) Fig.5 Seasonally (a-d) and annually (e) averaged diurnal variations in latent heat flux measured by eddy covariance and simulated by three models in Lake Taihu(EC, TM, GH and DR have the same meanings to Fig. 3) |

|
图 6 3种模型LE模拟误差(模拟值减去实测值)的年平均日变化(A)和季节变化(B) Fig.6 Annually averaged diurnal variations(a) and seasonally averaged variations(b) in simulation errors (simulation minus measurement) of latent heat flux modelled by three models (b图底部给出了各季节实测LE的平均值) (The mean EC LE values for each season are also included at the bottom of Fig.(b)) |
传统质量传输模型在春、夏、冬季模拟效果明显优于其它模型, 对LE的高估分别为3.7、2.3和1.5 W/m2.但该模型在秋季对LE低估了9.0 W/m2, 与DYRESM模型模拟效果(高估8.7 W/m2)相当, 仍优于Granger and Hedstrom模型(高估12.6 W/m2).传统质量传输模型秋季模拟效果较差, 可能与秋季BFG站沉水植物生长旺盛降低了水汽界面的动量粗糙长度有关[28, 44]. Granger and Hedstrom模型和DYRESM模型在四季均高估太湖水面蒸发, 2个模型夏季模拟值的绝对误差最大, 对太湖蒸发的高估分别为32.5和29.4 W/m2;而2个模型冬季模拟值的相对偏差最大, 分别达到LE实测值(28.22 W/m2)的72 %和35 %.另外, Granger and Hedstrom模型高估程度在春、夏、秋季比DYRESM模型大3~5 W/m2, 而冬季却高达10 W/m2(图 5a~d和图 6b). Granger and Hedstrom模型引入空气与水面的温度差来表征大气稳定状况, 该模型高估了大气稳定度对潜热通量的重要性[34], 低估了水汽界面湿度差对湖泊潜热交换的贡献.太湖水面上方大气全天超过90 %的时间都处于不稳定状态[4], 仅在太阳落山前呈微弱的逆温现象, 故强调大气稳定度贡献的Granger and Hedstrom模型会全天高估太湖潜热通量, 以太阳落山前大气稳定时为甚.冬季水面经常出现大气稳定状况[34], 这也解释了为什么冬季Granger and Hedstrom模型模拟值与EC LE值相关性最差.
2.3.2 水汽传输系数取值带来的误差传统质量传输模型和DYRESM模型对湖泊水面蒸发的模拟效果依赖于水汽交换系数的取值[44]. 图 7显示了BFG站水汽交换系数CE值随10 m高度风速的变化关系. BFG站CE值在0.8×10⁻³~2.1×10⁻³之间变化, 当u<4 m/s时, CE随风速增加而迅速减小至1.0×10⁻³;当u>4 m/s时, CE值几乎不随风速变化, 在0.8×10⁻³上下波动, 与Xiao等[44]研究结果相似.对比观测值和Garratt模型模拟值发现[25], 在低风速(u<2 m/s)不稳定大气状况下, Garratt模型对CE值低估了0.2×10⁻³~0.8×10⁻³;在中高风速(u>5 m/s)稳定或中性大气状况下, Garratt模型对CE值高估了0.25×10⁻³.

|
图 7 避风港站CE值随u的变化特征 Fig.7 Variation in transfer coefficient of water vapor (CE) with wind speeds at 10 m height at the BFG station(Big circle denotes the bin average (bin width of 1 m/s), Error bars are one standard deviation of measurements for each bin) (大圆点为1 m/s间隔内的平均值, 误差线表示各间隔内观测值的1倍标准差) |
综上分析, 传统质量传输模型CE全天取定值(1.0×10⁻³), 在上午中等风速(u ≈ 4 m/s)条件下, 模型的CE值接近实际值, 该模型上午对LE的低估(6 %)主要是其他因素引起;而午后高风速(u>5 m/s)条件下, CE值约为0.8×10⁻³, 模型高估的0.2×10⁻³ CE值使其午后高估了4 %的LE.该模型秋季系统性地低估LE, 与秋季BFG站沉水植被生长旺盛, 降低水面粗糙度, 模型CE取值偏低有关[44].对于DYRESM模型, CE取值(1.3×10⁻³)偏大, 使得该模型系统性地高估LE.此外, 该模型中汽化潜热L取常数(2.453×10⁶ J/kg), 忽略了其随温度而变化的特征, 对模拟结果具有一定影响.
3 结论用3种模型对太湖小时尺度水面蒸发进行模拟,发现传统质量传输模型适用性最佳,DYRESM模型模拟效果次之, Granger and Hedstrom模型经验性强, 适用性最差.具体结论如下:
1) 影响太湖小时尺度水面蒸发的主要单因子是水—气界水汽压梯度和风速, 且两者乘积与潜热通量观测值相关性最强(0.85), 对其解释程度达到72 %.
2) 传统质量传输模型在春、夏、冬季模拟的绝对误差和相对误差均分别小于4 W/m2和7 %, 而秋季的模拟误差(低估9 W/m2, 13 %)与DYRESM模型(高估8.7 W/m2, 12.7 %)的数值相当, Granger and Hedstrom模型四季模拟误差均最大, 以冬季高估最为明显(20 W/m2, 72 %).传统质量传输模型模拟值与实测值日变化最为接近, 夜间模拟相对误差小于3 %, Granger and Hedstrom模型在午后高估最为明显(22~32 W/m2).
3) 传统质量传输模型和DYRESM模型忽略了水汽交换系数随风速的变化特征, 给太湖小时尺度水面蒸发模拟带来误差, 以低风速和高风速下最为明显. Granger and Hedstrom模型过于强调大气稳定度对水面蒸发的影响, 使其在大气稳定时段(日落前后和冬季)的模拟误差最大.
| [1] |
Ma RH, Yang GS, Duan HT et al. China's lakes at present:Number, area and spatial distribution. Science China Earth Sciences, 2011, 54(2): 283-289. DOI:10.1007/s11430-010-4052-6 |
| [2] |
Samuelsson P, Kourzeneva E, Mironov D. The impact of lakes on the European climate as simulated by a regional climate model. Boreal Environment Research, 2010, 15(2): 113-129. |
| [3] |
Zhao L, Jin JM, Wang SY et al. Integration of remote-sensing data with WRF to improve lake-effect precipitation simulations over the Great Lakes region. Journal of Geophysical Research Atmospheres, 2011, 117(D9): 9102. DOI:10.1029/2011JD016979 |
| [4] |
Wang Wei. Energy budget at Lake Taihu and its response to climate change[Dissertation]. Nanjing:Nanjing University of Information Science and Technology, 2014. [王伟. 太湖能量收支及其对气候变化的响应[学位论文]. 南京: 南京信息工程大学, 2014. http://cdmd.cnki.com.cn/Article/CDMD-10300-1015578884.htm ]
|
| [5] |
Li ZG, Lyu SH, Ao YH et al. Long-term energy flux and radiation balance observations over Lake Ngoring, Tibetan Plateau. Atmospheric Research, 2015, 155(155): 13-25. DOI:10.1016/j.atmosres.2014.11.019 |
| [6] |
Flagg D, Brook J, Sills D et al. Lake Breezes in Southern Ontario:Observations, models and impacts on air quality. Nato Security Through Science, 2008, 679-680. DOI:10.1007/978-1-4020-8453-9_84 |
| [7] |
Sills DML, Brook JR, Levy I et al. Lake breezes in the southern Great Lakes region and their influence during BAQS-Met 2007. Atmospheric Chemistry & Physics, 2011, 11(15): 7955-7973. DOI:10.5194/acp-11-7955-2011 |
| [8] |
Tanny J, Cohen S, Assouline S et al. Evaporation from a small water reservoir:Direct measurements and estimates. Journal of Hydrology, 2008, 351(1-2): 218-229. DOI:10.1016/j.jhydrol.2007.12.012 |
| [9] |
Tanny J, Cohen S, Berger D et al. Evaporation from a reservoir with fluctuating water level:Correcting for limited fetch. Journal of Hydrology, 2011, 404(3-4): 146-156. DOI:10.1016/j.jhydrol.2011.04.025 |
| [10] |
Nordbo A, Launiainen S, Mammarella I et al. Long-term energy flux measurements and energy balance over a small boreal lake using eddy covariance technique. Journal of Geophysical Research Atmospheres, 2011, 116(D2): 3-25. DOI:10.1029/2010JD014542 |
| [11] |
McGloin R, McGowan H, McJannet D et al. Quantification of surface energy fluxes from a small water body using scintillometry and eddy covariance. Water Resources Research, 2014, 50(1): 494-513. DOI:10.1002/2013WR013899 |
| [12] |
McJannet DL, Cook FJ, McGloin RP et al. Estimation of evaporation and sensible heat flux from open water using a large aperture scintillometer. Water Resources Research, 2011, 47(5): 1-14. DOI:10.1029/2010WR010155 |
| [13] |
McJannet D, Cook F, McGloin R et al. Long-term energy flux measurements over an irrigation water storage using scintillometry. Agricultural & Forest Meteorology, 2013, 168(1): 93-107. DOI:10.1016/j.agrformet.2012.08.013 |
| [14] |
McGloin R, McGowan H, McJannet D. Effects of diurnal, intra-seasonal and seasonal climate variability on the energy balance of a small subtropical reservoir. International Journal of Climatology, 2015, 35(9): 2308-2325. DOI:10.1002/joc.4147 |
| [15] |
Wang W, Xiao W, Cao C et al. Temporal and spatial variations in radiation and energy balance across a large freshwater lake in China. Journal of Hydrology, 2014, 511(7): 811-824. DOI:10.1016/j.jhydrol.2014.02.012 |
| [16] |
Liu HZ, Feng JW, Sun JH et al. Eddy covariance measurements of water vapor and CO2 fluxes above the Erhai Lake. Science China Earth Sciences, 2015, 58(3): 1-12. DOI:10.1007/s11430-014-4828-1 |
| [17] |
Blanken PD, Rouse WR, Culf AD et al. Eddy covariance measurements of evaporation from Great Slave Lake, Northwest Territories, Canada. Water Resources Research, 2000, 36(4): 1069-1077. DOI:10.1029/1999WR900338 |
| [18] |
Lenters JD, Kratz TK, Bowser CJ. Effects of climate variability on lake evaporation:Results from a long-term energy budget study of Sparkling Lake, northern Wisconsin (USA). Journal of Hydrology, 2005, 308(1-4): 168-195. DOI:10.1016/j.jhydrol.2004.10.028 |
| [19] |
Granger RJ, Hedstrom N. Modelling hourly rates of evaporation from small lakes. Hydrology & Earth System Sciences, 2011, 15(1): 267-277. DOI:10.5194/hess-15-267-2011 |
| [20] |
Assouline S, Tyler SW, Tanny J et al. Evaporation from three water bodies of different sizes and climates:Measurements and scaling analysis. Advances in Water Resources, 2008, 31(1): 160-172. DOI:10.1016/j.advwatres.2007.07.003 |
| [21] |
Liu HP, Zhang Y, Liu SH et al. Eddy covariance measurements of surface energy budget and evaporation in a cool season over southern open water in Mississippi. Journal of Geophysical Research Atmospheres, 2009, 114(D4): 83-84. DOI:10.1029/2008JD010891 |
| [22] |
Liu HP, Zhang QY, Dowler G. Environmental controls on the surface energy budget over a large southern inland water in the United States:An analysis of one-year eddy covariance flux data. Journal of Hydrometeorology, 2012, 13(6): 1893-1910. DOI:10.1175/JHM-D-12-020.1 |
| [23] |
Stull RB. AnIntroduction to Boundary Layer Meteorology. New York: Kluwer Academic Publishers, 1988, 515-520.
|
| [24] |
Henderson-Sellers B. Calculating the surface energy balance for lake and reservoir modeling:A review. Reviews of Geophysics, 1986, 24(3): 625-649. DOI:10.1029/RG024i003p00625 |
| [25] |
Garratt JR. TheAtmospheric Boundary Layer. Cambridge: Cambridge University Press, 1994, 316.
|
| [26] |
Zhao Xiaosong, Wang Shigang, Li Mei et al. Energy flux measurements and environmental controls in summer over the Poyang Lake, China. J Lake Sci, 2014, 26(6): 955-962. [赵晓松, 王仕刚, 李梅等. 鄱阳湖夏季水热通量特征及环境要素影响分析. 湖泊科学, 2014, 26(6): 955-962. DOI:10.18307/2014.0619] |
| [27] |
Zhao Xiaosong, Li Mei, Wang Shigang et al. Comparison of actual water evaporation and pan evaporation in summer over the Lake Poyang, China. J Lake Sci, 2015, 27(2): 343-351. [赵晓松, 李梅, 王仕刚等. 鄱阳湖夏季水面蒸发与蒸发皿蒸发的比较. 湖泊科学, 2015, 27(2): 343-351. DOI:10.18307/2015.0220] |
| [28] |
Xiao Wei, Liu Shoudong, Li Xuhui et al. Transfer coefficients of momentum, heat and water vapor in the atmospheric surface layer of a large shallow freshwater lake:A case study of Lake Taihu. J Lake Sci, 2012, 24(6): 932-942. [肖薇, 刘寿东, 李旭辉等. 大型浅水湖泊与大气之间的动量和水热交换系数——以太湖为例. 湖泊科学, 2012, 24(6): 932-942. DOI:10.18307/2012.0617] |
| [29] |
Ren Xiaoqian, Sun Shufen, Chen Wen et al. A review of researches on the lake numerical modeling. Advances in Earth Science, 2013, 28(3): 347-356. [任晓倩, 孙菽芬, 陈文等. 湖泊数值模拟研究现状综述. 地球科学进展, 2013, 28(3): 347-356. DOI:10.11867/j.issn.1001-8166.2013.03.0347] |
| [30] |
Sun Shufen, Yan Jinfeng, Xia Nan et al. The heat transfer research between land or water and atmosphere. Chinese Science:G:Physics Mechanics Astronantics, 2008, 38(6): 704-713. [孙菽芬, 颜金凤, 夏南等. 陆面水体与大气之间的热传输研究. 中国科学:G辑:物理学·力学·天文学, 2008, 38(6): 704-713.] |
| [31] |
Mcjannet DL, Cook FJ, Burn S. Comparison of techniques for estimating evaporation from irrigation water storage. Water Resources Research, 2013, 49(3): 206-207. DOI:10.1002/wrcr.20125 |
| [32] |
Rosenberry DO, Winter TC, Buso DC et al. Comparison of 15 evaporation methods applied to a small mountain lake in the northeastern USA. Journal of Hydrology, 2007, 340(3-4): 149-166. DOI:10.1016/j.jhydrol.2007.03.018 |
| [33] |
Mao Rui. Forecasting model of evaporation from Taihu Lake and its application. J Lake Sci, 1992, 4(4): 8-13. [毛锐. 太湖水面蒸发量预报模型及其应用. 湖泊科学, 1992, 4(4): 8-13. DOI:10.18307/1992.0402] |
| [34] |
McGloin R, McGowan H, McJannet D et al. Modelling sub-daily latent heat fluxes from a small reservoir. Journal of Hydrology, 2014, 519(Part B): 2031-2311. DOI:10.1016/j.jhydrol.2014.10.032 |
| [35] |
Dutra E, Stepanenko VM, Balsamo G et al. An offline study of the impact of lakes on the performance of the ECMWF surface scheme. Boreal Environment Research, 2010, 15(2): 100-112. |
| [36] |
Liu XH, Zhang YL, Yan Y et al. Wind and submerged aquatic vegetation influence bio-optical properties in large shallow Lake Taihu, China. Journal of Geophysical Research Biogeosciences, 2013, 118(2): 713-727. DOI:10.1002/jgrg.20054 |
| [37] |
Lee X, Finnigan J, Kyaw TPU. Coordinate Systems and Flux Bias Error. In:Lee X, Massman W, Law B eds. Handbook of Micrometeorology:A guide for surface flux measurement and analysis. New York: Kluwer Academic Publishers, 2004, 33-36.
|
| [38] |
Lee X, Massman WJ. A perspective on thirty years of the Webb, Pearman and Leuning density corrections. Boundary-Layer Meteorology, 2011, 139(1): 37-59. DOI:10.1007/s10546-010-9575-z |
| [39] |
Webb EK, Pearman GI, Leuning R. Correction of flux measurements for density effects due to heat and water vapour transfer. Quarterly Journal of the Royal Meteorological Society, 1980, 106(447): 85-100. DOI:10.1002/qj.49710644707 |
| [40] |
Wilczak JM, Oncley SP, Stage SA. Sonic anemometer tilt correction algorithms. Boundary-Layer Meteorology, 2001, 99(1): 127-150. DOI:10.1023/A:1018966204465 |
| [41] |
Foken T, Leuning R, Oncley SR et al. Corrections and data quality control. In:Aubinet M, Vesala T, Papale D eds. Eddy covariance. Berlin: Springer Netherlands, 2012, 85-131.
|
| [42] |
Mauder M, Foken T. Documentation and instruction manual of the eddy covariance software package, 2004. https://www.researchgate.net/publication/50383381_Documentation_and_Instruction_Manual_of_the_Eddy_Covariance_Software_Package_TK2
|
| [43] |
Leuning R. Measurements oftrace gas fluxes in the atmosphere using eddy covariance:WPL Corrections Revisited. In:Lee X, Massman W, Law B eds. Handbook of Micrometeorology:A guide for surface flux measurement and analysis. New York: Kluwer Academic Publishers, 2004, 119-132.
|
| [44] |
Xiao W, Liu SD, Wang W et al. Transfer coefficients of momentum, heat and water vapour in the atmospheric surface layer of a large freshwater lake. Boundary-Layer Meteorology, 2013, 148(3): 479-494. DOI:10.1007/s10546-013-9827-9 |
| [45] |
Arya PS, Holton JR. Introduction to Micrometeorology. New York: Academic Press, 2001, 398.
|
| [46] |
Fiebrich CA, Martinez JE, Brotzge JA et al. The Oklahoma mesonet's skin temperature network. Journal of Atmospheric & Oceanic Technology, 2010, 20(20): 1496-1504. DOI:10.1175/1520-0426(2003)020<1496:TOMSTN>2.0.CO;2 |
| [47] |
Imberger J, Patterson JC. A dynamic reservoir simulation model-DYRESM:5. Transport Models/inland & Coastal Waters, 1981, 310-361. |
| [48] |
Imerito A. Dynamic Reservoir Simulation Model DYRESM v4:v4.0 Science Manual. Centre for Water Research University of Western Australia, Perth, 2010. http://www.mendeley.com/research/dynamic-reservoir-simulation-model-dyresm-v4-v4-0-science-manual/
|
| [49] |
Weisman RN, Brutsaert W. Evaporation and cooling of a lake under unstable atmospheric conditions. Water Resources Research, 1973, 9(5): 1242-1257. DOI:10.1029/WR009i005p01242 |
| [50] |
Verburg P, Antenucci JP. Persistent unstable atmospheric boundary layer enhances sensible and latent heat loss in a tropical great lake:Lake Tanganyika. Journal of Geophysical Research Atmospheres, 2010, 115(D11): D11109. DOI:10.1029/2009JD012839 |
| [51] |
Bouin MN, Legain D, Traulle O et al. Using scintillometry to estimate sensible heat fluxes over water:First insights. Boundary-Layer Meteorology, 2012, 143(3): 451-480. DOI:10.1007/s10546-012-9707-8 |
| [52] |
Travis CC, Arms AD. Bioconcentration of organics in beef, milk, and vegetation. Environmental Science & Technology, 1988, 22(3): 271-4. |
| [53] |
Zhang QY, Liu HP. Seasonal changes in physical processes controlling evaporation over inland water. Journal of Geophysical Research Atmospheres, 2015, 119(16): 9779-9792. DOI:10.1002/2014JD021797 |
| [54] |
Legates DR, Mccabe GJ. Evaluating the use of "goodness-of-fit" Measures in hydrologic and hydroclimatic model validation. Water Resources Research, 1999, 35(1): 233-241. DOI:10.1029/1998WR900018 |
| [55] |
Willmott CJ. On the validation of models. Physical Geography, 1981, 55(2): 184-194. |
| [56] |
Nash JE, Sutcliffe JV. River flow forecasting through conceptual models part I-A discussion of principles. Journal of Hydrology, 1970, 10(3): 282-290. DOI:10.1016/0022-1694(70)90255-6 |
| [57] |
Dawson CW, Harpham C, Wilby RL et al. Evaluation of artificial neural network techniques for flow forecasting in the River Yangtze, China. Hydrology & Earth System Sciences, 2002, 6(4): 619-626. |
| [58] |
Dawson CW, Abrahart RJ, See LM. Hydrotest:A web-based toolbox of evaluation metrics for the standardised assessment of hydrological forecasts. Environmental Modelling & Software, 2007, 22(7): 1034-1052. DOI:10.1016/j.envsoft.2006.06.008 |
| [59] |
Makridakis S. Accuracy measures:Theoretical and practical concerns. International Journal of Forecasting, 1993, 9(4): 527-529. DOI:10.1016/0169-2070(93)90079-3 |
 2017, Vol. 29

