(2: 江西师范大学地理与环境学院, 南昌 330022)
(2: School of Geography and Environment, Jiangxi Normal University, Nanchang 330022, P. R. China)
河流是工农业生产和生活用水的来源,也是水循环的重要场所.金属元素经水循环进入河流,因其稳定的结构难降解于水体,即使微量进入水体,对环境也能起到一定的毒害作用[1-3].自然和人类活动是金属元素的主要来源,人类活动如金属冶炼、采矿、工业废水排放和农业污水等已威胁到环境和人类身体的健康[4-5].因不合理的人类活动,大量污染物进入河流,导致河流水体金属元素含量超标,引起了国内外学者的关注[6-7].河流水体中的金属元素可分为溶解态和颗粒态两种形态,受人类活动污染的水体,更多的金属元素与有机质结合以自由离子态存在,溶解态占有更大的比例[8-9].
鄱阳湖是我国最大的淡水湖泊,也是生物多样性极其丰富的淡水湿地生态系统.近年来,随着流域矿产开采和金属冶炼废水排放、工农业的发展及城市化的扩展,湖区呈现出不同程度的重金属污染[10].赣江是鄱阳湖的第一大支流,鄱阳湖Pb、Zn、Cu、Ni、As和Cd入湖通量的75.4 %、56.8 %、47.3 %、30.6 %、25.5 %和23.2 % [11]来自赣江.因此查明赣江流域溶解态金属元素的空间分布特征和污染来源,对赣江流域的水环境保护和鄱阳湖流域的污染防治具有重要意义.已有研究表明,赣江流域可溶态Cd的浓度在中国Ⅰ类地表水环境质量标准内[12],仅赣江赣州市段和赣江吉安市段的可溶态Cd和As超出了中国Ⅲ类地表水环境质量标准[13].目前关于赣江金属元素的研究集中在时空分布[13]和风险评价[14]方面,尚不清楚溶解态金属元素的污染来源及不同污染来源的贡献率.查明赣江流域溶解态金属元素的污染来源和污染来源的贡献率是进行污染防治的基础.本研究基于赣江水系枯水期和丰水期溶解态金属元素数据,分析溶解态金属元素的空间分布特征,探讨溶解态金属元素的污染来源并估算污染来源的贡献率,以期为赣江流域和鄱阳湖溶解态金属元素污染的防治提供科学依据.
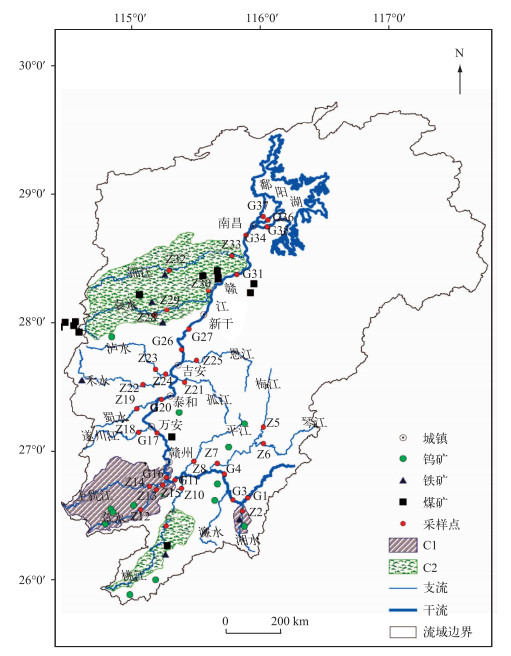
1 材料与方法 1.1 研究区域概况赣江源于闽赣交界的武夷山区,自南向北经赣州、吉安、宜春、南昌等城市进入鄱阳湖.赣江流域属于亚热带季风湿润气候,年平均降雨量为1580 mm,径流量约占鄱阳湖水系总径流量的46.6 %.赣州市和新干县把赣江分为上、中、下游.赣江上游流经矿产资源丰富的地区,同时也流经了我国重要脐橙种植区;中游流经吉泰盆地水稻种植区;下游流经宜春、新余、南昌等主要城市,其中袁水和锦江沿岸煤矿和铁矿资源丰富[15-18].赣江流域主要的煤矿、铁矿和钨矿分布详见图 1.

|
图 1 赣江水系采样位点分布(C1、C2分别为聚类分析(见2.3节)形成的区域.煤矿、铁矿和钨矿分布根据《江西省志》[19]和赣州市环境信息发布平台(http://www.gzhb.gov.cn/infopublic/flexoutput/)绘制) Fig.1 Distributions of sampling sites in the Ganjiang River |
为研究赣江干流不同河段溶解态金属元素的污染来源,对干流的上游、中游、下游设置若干个采样点(用G表示);为研究支流溶解态金属元素的污染来源,在主要支流中下游设置若干个采样点(用Z表示),共设置了37个(图 1).于2015年1月(枯水期)和7月(丰水期)分别对应赣江流域的干流和支流中央50 cm深的水样进行采集,并现场用GPS(GPS,MAP62sc,USA)对采样点进行定位.每次选用顺流采样方式,每个点位水样用500 ml的塑料瓶收集,在实验室用0.45 μm孔径的醋酸纤维滤膜抽滤,并加硝酸酸化至pH<2保存于0~4℃的环境下,用于测定溶解态金属元素的浓度.用电感耦合等离子体质谱仪(ICP-MS X Series, PE, USA)测定水样中Be、Al、V、Mn、Fe、Co、Ni、Cu、As、Mo、Cd、Sb、Tl、Pb、U的浓度.样品在检测之前,仪器利用标准物质(SRM, AccuStandard, Inc., USA)进行3次重复检测并且进行极限检测,这15种溶解态金属元素的极限检测值分别为0.004、0.065、0.04、0.011、1.929、0.005、0.044、0.042、0.094、0.003、0.001924、0.004019、0.004068、0.002338和0.000159 μg/L.所有元素2次平行测样的相对标准偏差(RSD)均低于10 %.
1.3 数据分析根据15种溶解态金属元素数据,运用单因素方差分析和聚类分析探讨了溶解态金属元素的空间分布差异[20],并运用主成分分析识别溶解态金属元素的主要污染源.
绝对主成分得分/多元线性回归分析(APCS-MLR)是基于主成分得分进行的线性回归分析的一种受体模型[21],广泛用于定量估算污染源的贡献率[22-25].由于主成分分析的结果保留的是标准化后的数据,绝对零值因子得分计算公式为:
| $ {Z_0} = \frac{{0-{c_i}}}{{{\sigma _i}}} = \frac{{-{c_i}}}{{{\sigma _i}}} $ | (1) |
式中,i为元素的种类数,其中ci和σi分别代表第i种元素平均浓度和第i种元素的标准差.
绝对主成分得分通过PCA因子得分减去对应绝对零值因子得分估算.进行线性回归分析(公式(2)),获得回归系数及污染源贡献率:
| $ {M_j} = {\delta _0} + \sum\limits_{k = 1}^p {{\delta _k} \cdot APC{S_{kj}}} $ | (2) |
式中,Mj为第j个样品的元素浓度,APCSkj为第k个污染源在第j个样品旋转后的绝对主成分得分,δk·APCSkj为第k个污染源在第j个样品的贡献率,δ0是PCA分析中主要污染源之外的其他污染来源.
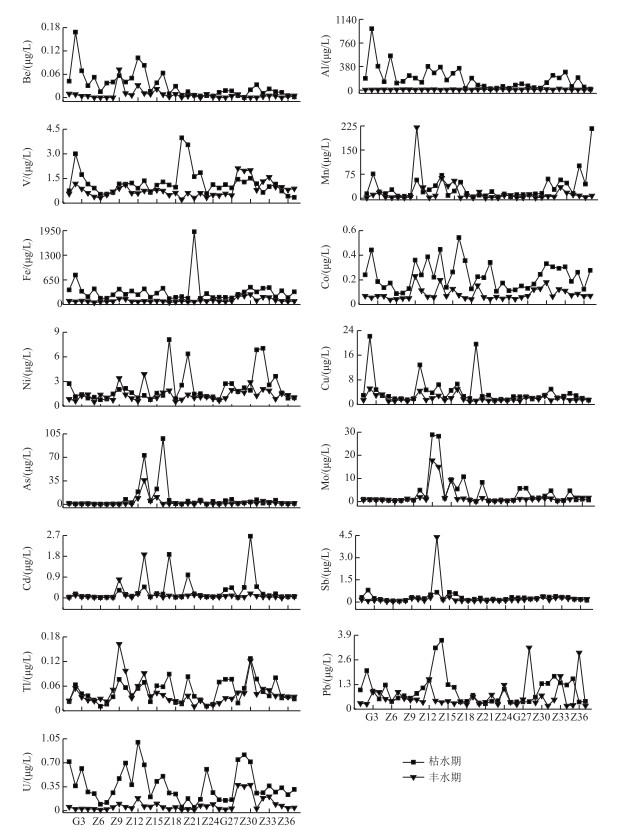
2 结果与讨论 2.1 溶解态金属元素空间分布特征赣江水系溶解态金属元素Be、Al、V、Fe、Co、Ni、Cu、U浓度枯水期显著高于丰水期,其他元素差异不显著. Al、Ni、Cu、As、Cd、Sb、Pb、U和Be、V、Mn、Fe、Co、Ni、Cu、As、Mo、Cd、Sb、Tl、Pb的平均浓度低于世界卫生组织(WHO)饮用水质准则和中国Ⅲ类地表水环境质量标准(表 1).但Al和As分别有1和6个采样点超出了世界卫生组织饮用水质准则,超标率分别为1.35 %和8.10 %;Fe、Mn和Tl有16、3和3个采样点超出了中国Ⅲ类地表水环境质量标准,超标率分别为21.60 %、4.05 %和4.05 %.本次研究发现赣江水系Cd浓度在水质标准内,与张宝军等[12]2013年的研究结果一致,与计勇等[13]2010年的分析结果中Cd浓度在赣江赣州市段超标不一致;As浓度在中国Ⅲ类地表水环境质量标准内,与计勇等[13]2010年的分析结果中As在赣江赣州市段与赣江吉安市段超出了中国Ⅲ类地表水环境质量标准不一致,说明近年来Cd和As污染已明显减轻.
| 表 1 赣江水系溶解态金属元素的统计特征和水质标准* Tab.1 Statistics of dissolved metal concentrations in the Ganjiang River and the water standards |
赣江溶解态金属元素浓度大小排序为:Fe>Al>Mn>As>Cu>Mo>Ni>V>Pb>Sb>U>Cd>Co> Tl>Be. Fe、Al、Mn的平均浓度分别是印度苏伯尔讷雷卡河的1.6、1.5和2倍,其中Fe的平均浓度是汉江的7倍、渭河的20倍. Co、Ni、Cu、As、Cd、Pb的平均浓度低于乐安河、长江、湘江、滦河、多瑙河. Mo和Sb的平均浓度分别低于渭河和汉江,可知赣江流域的Fe、Al、Mn浓度较高,Co、Ni、Cu、As、Mo、Cd、Sb、Pb浓度较低(表 2).
| 表 2 国内外河流溶解态金属元素研究结果(μg/L)* Tab.2 Dissolved metals in domestic and oversea rivers |
Be、Al、Mn、Pb、U浓度在上游、中游、下游存在显著差异,其他元素差异不显著. Ni和Mo浓度在干流与支流间存在显著差异,其他元素差异不显著. Be、Al浓度在上游显著高于中下游,Be、Al、Cu、Co浓度在湘水、章水和赣江赣州市段高,Cu和Co浓度分别在中游河段蜀水和孤江浓度高,在其他采样点浓度较低. As、Mo、Sb浓度在章水出现峰值,其中As浓度在赣江赣州市段出现最大值,其他采样点较低. Mn、Pb、U浓度在下游显著高于中上游,在章水出现峰值,其中Mn浓度在桃江出现最大值,在中游降低,在下游袁水、锦江增加,在赣江北支浓度最高. Ni、Cd、Tl浓度在桃江、章水、赣江万安县段、赣江泰和县段、袁河较高,其他采样点较低. V、Fe浓度在支流高于干流,分别在蜀水、泷江出现最大值,在湘水的浓度高于多数河段(表 3和图 2).

|
图 2 赣江水系溶解态金属元素的时空分布 Fig.2 Spatio-temporal distribution of dissolved metals in the Ganjiang River |
| 表 3 赣江水系不同河段的溶解态金属元素浓度* Tab.3 Concentrations of dissolved metals in different reaches of the Ganjiang River |
为验证因子分析的适用性,对数据进行KMO(Kaiser-Meyer-Olkin)和巴特利特球形度检验,一般认为KMO>0.7时适合因子分析.通过检验发现,在P < 0.001时KMO值为0.837,球形度检验值为869.42,表明采用主成分分析是有效的. 3个主成分反映了69.82 %的变量信息,揭示了15种金属元素可能存在的3种来源(表 4).
| 表 4 赣江水系溶解态金属元素主成分旋转载荷* Tab.4 Rotating loadings of dissolved metals on principal components in the Ganjiang River |
PC1解释了30.55 %的方差变异,Be、Al、Fe、Co、U占有较高的正载荷(本研究中以R>0.7判定为载荷较高[37]),Mn、Cu和Pb具有较低载荷.桃江、湘水和章水流域Mn,Be、Al、Cu和Pb、U浓度分别出现最大值.锡矿[38]和钨矿[39]中含有Be、Al、Fe、Pb、Co元素,桃江、湘水和章水流域分别是稀土矿[40]、锡矿、钨矿开采频繁的河段(见赣州市环境信息发布平台http://www.gzhb.gov.cn/infopublic/flexoutput/),采矿废水排放入河,导致该区域Mn、Be、Al、Cu、Pb、U浓度增加. Be、Al、Fe、Co、U、Cu浓度在枯水期显著高于丰水期(表 1和图 2),体现了丰水期降水对采矿废水的稀释作用. PC1表示溶解态金属元素的采矿废水来源.
PC2解释了22.61 %的方差变异,Mo在该成分的载荷最高,其次为As、Tl、Sb和Cd. Tl和As、Mo、Sb分别在桃江和章水出现峰值.矿产废渣中含有丰富的As、Sb、Cd元素[41-42],施用化肥农药也会导致As和Cd残留于土壤中[43],桃江和章水流域的稀土和钨矿分布广泛(图 1),同时也是农业种植区和脐橙种植区,降雨淋滤把矿渣和土壤中的As、Sb、Cd带入河流,导致As、Sb、Cd浓度在该区域出现最大值. As、Mo、Cd、Sb、Tl浓度在丰水期和枯水期不存在显著差异,体现了长期受降水淋滤的影响. PC2表示溶解态金属元素的矿渣和农田土壤降雨淋滤来源.
PC3解释了16.66 %的方差变异,Ni在该成分上占有的载荷最高,其次为V;Fe、Co、Sb和Tl与PC3具有相近的载荷. Ni、Co浓度分别在赣江万安县段、赣江赣州市段出现最大值;对比3个区域污染水平,Ni和V浓度在C2最高(表 4),V、Ni、Fe和Co的平均浓度在枯水期显著高于丰水期(表 1).钢铁冶炼废水中含有大量Ni、Fe、Co[44]和V[45]元素,袁水、锦江流域煤矿、铁矿资源分布广泛(图 1),受钢铁冶炼废水排放影响,该区域Ni、Fe、Co浓度出现最大值. PC3表示溶解态金属元素的钢铁冶炼废水来源.
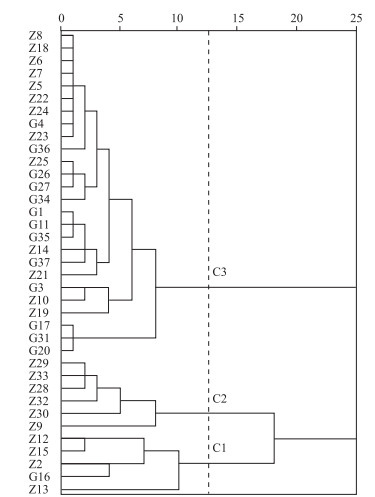
2.3 溶解态金属元素区域污染差异根据各样点溶解态金属元素浓度的空间差异(图 2),再根据不同样点的层次聚类分析结果(图 3),赣江水系溶解态金属元素可以分为3个污染区域. 13.5 %的样点在区域1(C1),分布在湘水、章水和赣江赣州市段;16.2 %的采样点在区域2(C2),分布在桃江、袁水和锦江;70.3 %的采样点在区域3(C3)(图 1和图 3).据表 5可知,除Mn、Fe、Cd、Pb在3个区域中差异不显著外,其他元素差异显著. Be、Al、Cu、As、Mo、Sb的平均浓度在C1最高;V、Mn、Fe、Ni、Cd的平均浓度在C2最高;C3除Ni、Cu、Mo外,其他元素的平均浓度显著低于C1和C2. 3个区域元素的污染水平大小排序为:C1>C2>C3. C1是赣南矿产集中分布区,同时是我国重要的脐橙种植区,受采矿废水排放、矿渣和土壤降雨淋滤影响,Be、Al、Cu、As、Mo、Sb浓度最高. C2是铁矿、煤矿集中分布区,受沿岸钢铁冶炼废水排放的影响,V、Mn、Fe、Ni、Cd浓度最高. C3的支流河段采矿和农业活动少于C1和C2,同时C3包括了大部分干流,因支流汇入导致径流量增加,从而稀释了部分溶解态金属元素,使溶解态金属元素浓度低于C1和C2.

|
图 3 赣江水系溶解态金属元素聚类分析树形图 Fig.3 Hierarchical cluster tree of sampling sites by Cluster Analysis of dissolved metals in the Ganjiang River |
| 表 5 赣江水系各区域溶解态金属元素平均值和标准误差* Tab.5 Mean values with standard errors of dissolved metals in different regions in the Ganjiang River |
在主成分分析识别赣江水系溶解态金属元素污染来源基础上,用绝对主成分/多元线性回归(MLR-APCS)计算了赣江水体15种溶解态金属元素的污染源贡献率.除Mn、Fe、Pb、U的R2小于0.6外,其他元素都在0.6以上(表 6),说明回归分析具有统计学意义[46]. Be、Al、Cu、Pb、U的污染源超过40 %来自采矿废水,其中Be、Al、U超过了70 %,Mo的采矿废水贡献率最低,其次为Co和Sb. Cu、As、Mo、Cd的污染源超过35 %来自矿渣和农田土壤降雨淋滤,其中Cu的贡献率最大,其次为Cd和Mo,Mn的矿渣和农田土壤降雨淋滤贡献率最低,其次为Al、V、Ni、Tl、Pb和Fe. V、Mn、Co、Ni的污染源超过41 %来自钢铁冶炼废水,其中Mo超过了60 %,As的钢铁冶炼废水贡献率最低,其次为Cu和Tl. Fe的采矿废水和金属冶炼废水贡献率都为35 %,其来源可能主要受两者双重影响. V、Fe、Co、Ni、Cd、Sb、Tl、Pb除受已识别的3种源影响外,还受其他污染源的影响,其中V、Co、As、Sb、Tl、Pb不可识别源的比例超过30 %.
| 表 6 赣江水系溶解态金属元素多元线性回归绝对因子得分贡献率* Tab.6 Source contributions of dissolved metals in the Ganjiang River water resulting from multi-linear regression of the absolute principal component score (MLR-APCS) |
本次研究基于赣江流域枯水期和丰水期溶解态金属元素的数据,探讨溶解态金属元素的空间分布特征、污染来源及污染来源的贡献率,结果表明多数水样的溶解态金属元素浓度符合水质标准,主要超标元素(样品超标率)为Fe(21.60 %)、As(8.10 %)、Mn(4.05 %)、Tl(4.05 %)和Al(1.35 %).赣江水系受溶解态金属元素污染的主要河段为湘水、章水和赣江赣州市段,主要污染金属元素分别是Be、Al、Cu、As、Mo、Sb;其次为桃江、袁水和锦江,主要污染金属元素分别是V、Mn、Fe、Ni、Cd.采矿废水、矿渣和农田土壤降雨淋滤、钢铁冶炼废水是赣江水系溶解态金属元素的主要来源. Be、Al、Cu、Pb、U的污染源超过40 %来自采矿废水;Cu、As、Mo、Cd的污染源超过35 %来自矿渣和农田土壤降雨淋滤;V、Mn、Co、Ni的污染源超过41 %来自钢铁冶炼废水.赣江流域南部和西北部矿产资源的开采加工是赣江水体溶解态金属元素的主要污染源,加强矿区的环境保护和治理是防治赣江金属元素污染的关键.
| [1] |
Sin SN, Chua H, Lo W et al. Assessment of heavy metal cations in sediments of Shing Mun River, Hong Kong. Environment International, 2001, 26(5): 297-301. |
| [2] |
Yuan G, Liu C, Chen L et al. Inputting history of heavy metals into the inland lake recorded in sediment profiles:Poyang Lake in China. Journal of hazardous materials, 2011, 185(1): 336-345. DOI:10.1016/j.jhazmat.2010.09.039 |
| [3] |
Armitage PD, Bowes MJ, Vincent HM. Long-term changes in macroinvertebrate communities of a heavy metal polluted stream:The river Nent (Cumbria, UK) after 28 years. River Research and Applications, 2007, 23(9): 997-1015. DOI:10.1002/(ISSN)1535-1467 |
| [4] |
Bo L, Wang D, Li T et al. Accumulation and risk assessment of heavy metals in water, sediments, and aquatic organisms in rural rivers in the Taihu Lake region, China. Environmental Science and Pollution Research, 2015, 22(9): 6721. DOI:10.1007/s11356-014-3798-3 |
| [5] |
Palma P, Ledo L, Alvarenga P. Assessment of trace element pollution and its environmental risk to freshwater sediments influenced by anthropogenic contributions:The case study of Alqueva reservoir (Guadiana Basin). Catena, 2015, 128: 174-184. DOI:10.1016/j.catena.2015.02.002 |
| [6] |
Zhao SN, Shi XH, Li CY et al. Distribution characteristics of mercury and pollution risk assessment in the water of Lake Ulansuhai. J Lake Sci, 2014, 26(2): 221-227. [赵胜男, 史小红, 李畅游等. 乌梁素海水体汞的分布特征及污染风险评估. 湖泊科学, 2014, 26(2): 221-227. DOI:10.18307/2014.0208] |
| [7] |
Licheng Z, Kezhun Z. Background values of trace elements in the source area of the Yangtze River. Science of the Total Environment, 1992, 125: 391-404. DOI:10.1016/0048-9697(92)90403-F |
| [8] |
Dahlem Workshop on Changing Metal Cycles, Human Health ed. Changing metal cycles and human health:Report of the Dahlem Workshop on Changing Metal Cycles and. Springer-Verlag, 1984.
|
| [9] |
Chapman DV ed. Water quality assessments:A guide to the use of biota, sediments, and water in environmental monitoring. London:CRC Press, 1996.
|
| [10] |
Zhang DW, Zhang L, He JH et al. Spatial distributions and risk assessment of dissolved heavy metals in Poyang Lake. Acta Ecologica Sinica, 2015, 35(24): 8028-8035. [张大文, 张莉, 何俊海等. 鄱阳湖溶解态重金属空间分布格局及风险评估. 生态学报, 2015, 35(24): 8028-8035.] |
| [11] |
Li WM, Yang ZF, Zhou L et al. Geochemical characteristic and fluxes of heavy metals in water system of the Poyang Lake. Geoscience, 2014, 28(3): 512-536. [李文明, 杨忠芳, 周雷等. 鄱阳湖水系重金属元素地球化学特征及入湖通量. 现代地质, 2014, 28(3): 512-536.] |
| [12] |
Zhang BJ, Zhu MN, Wang P et al. Spatial and temporal distribution of dissolved cadmium and water quality assessment of the water body of the Ganjiang River Catchment. Journal of Ecology and Rural Environment, 2014, 30(4): 495-499. [张宝军, 朱蒙曼, 王鹏等. 赣江流域水体中可溶态镉的时空分布特征及水质评价. 生态与农村环境学报, 2014, 30(4): 495-499.] |
| [13] |
Ji Y, Zhang J, Fan HB et al. Distribution characteristics of heavy metal and environmental assessment in the mid-lower reaches of the Ganjiang River. China Rural Water and Hydropower, 2013, 4(5): 42-45. [计勇, 张洁, 樊后保等. 赣江中下游城市断面重金属分布特征及生态风险评价. 中国农村水利水电, 2013, 4(5): 42-45.] |
| [14] |
Ji Y, Zhang J, Huang X et al. Investigation and assessment of heavy metals in surface sediments of Ganjiang River, China. Journal of Environmental Biology, 2014, 35(6): 1173-1179. |
| [15] |
Wang P, Chen DD, Chen B. The distribution characters and pollution sources of nitrogen and phosphorus nutrients in Ganjiang River. Journal of Jiangxi Normal University:Natural Science, 2015, 39(4): 435-440. [王鹏, 陈多多, 陈波. 赣江水体氮磷营养盐分布特征与污染来源. 江西师范大学学报:自然科学版, 2015, 39(4): 435-440.] |
| [16] |
Zhao ZG. Researches on development pattern of agriculture in the forest areas of Jiangxi Province based on land suitability evaluation. Hubei Agricultural Sciences, 2013, 52(22): 5634-5638. [赵志刚. 江西省林耕地适宜性评价与农业发展格局探讨. 湖北农业科学, 2013, 52(22): 5634-5638. DOI:10.3969/j.issn.0439-8114.2013.22.071] |
| [17] |
Zhang CH. Statistical analysis of industrial agglomeration in Jiangxi Province. Times Finance, 2016(17): 71-72. [张丛煌. 江西省工业集聚情况统计分析. 时代金融, 2016(17): 71-72.] |
| [18] |
Huang CG, Liu CG, Ding SH et al. Prediction type and characteristics of main mineral resources in Jiangxi Province. Resources Survey and Environment, 2015, 36(3): 196-202. [黄传冠, 刘春根, 丁少辉等. 江西省主要矿产预测类型及其地质特征. 资源调查与环境, 2015, 36(3): 196-202.] |
| [19] |
Compilation Committee of geological and mineral records of Jiangxi. Chronicles of Jiangxi Province 4. Beijing: China Local Records Publishing, 1998. [江西省地质矿产志编纂委员会编. 江西省志4. 北京: 方志出版社, 1998.]
|
| [20] |
Li S, Gu S, Liu W et al. Water quality in relation to land use and land cover in the upper Han River Basin, China. Catena, 2008, 75(2): 216-222. DOI:10.1016/j.catena.2008.06.005 |
| [21] |
Thurston GD, Spengler JD. A quantitative assessment of source contributions to inhalable particulate matter pollution in metropolitan Boston. Atmospheric Environment, 1985, 19(1): 9-25. DOI:10.1016/0004-6981(85)90132-5 |
| [22] |
Gholizadeh MH, Melesse A, Reddi L. Water quality assessment and apportionment of pollution sources using APCS-MLR and PMF receptor modeling techniques in three major rivers of South Florida. Science of the total Environment, 2016, 566: 1552-1567. |
| [23] |
Nazeer S, Ali Z, Malik RN. Water quality assessment of River Soan (Pakistan) and source apportionment of pollution sources through receptor modeling. Archives of Environmental Contamination and Toxicology, 2016, 71(1): 97-112. DOI:10.1007/s00244-016-0272-x |
| [24] |
Su S L, Li D, Zhang Q et al. Temporal trend and source apportionment of water pollution in different functional zones of Qiantang River, China. Water Research, 2011, 45(4): 1781-1795. DOI:10.1016/j.watres.2010.11.030 |
| [25] |
Zhou F, Huang GH, Guo HC et al. Spatio-temporal patterns and source apportionment of coastal water pollution in eastern Hong Kong. Water Research, 2007, 41(15): 3429-3439. DOI:10.1016/j.watres.2007.04.022 |
| [26] |
Organization WH ed. Guidelines for drinking-water quality:Recommendations. World Health Organization, 2004.
|
| [27] |
State Environmental Protection Administration, General Administration of Quality Supervision, Inspection and Quarantine of the People's Republic of China eds. State Standard of the People's Republic of China GB 3838-2002, 2002. [国家环境保护总局, 国家质量监督检验检疫总局. 中华人民共和国国家标准GB 3838-2002, 2002. ]
|
| [28] |
Wan JB, Yan WW, Xie T. Research on heavy metals pollution status of Le'an Rier, Lake Poyang Basin. J Lake Sci, 2007, 19(4): 421-427. [万金保, 闫伟伟, 谢婷. 鄱阳湖流域乐安河重金属污染水平. 湖泊科学, 2007, 19(4): 421-427. DOI:10.18307/2007.0410] |
| [29] |
Wang L, Wang Y, Xu C et al. Analysis and evaluation of the source of heavy metals in water of the River Changjiang. Environmental Monitoring and Assessment, 2011, 173(1/2/3/4): 301-313. |
| [30] |
Zeng X, Liu Y, You S et al. Spatial distribution, health risk assessment and statistical source identification of the trace elements in surface water from the Xiangjiang River, China. Environmental Science and Pollution Research, 2015, 22(12): 9400-9412. DOI:10.1007/s11356-014-4064-4 |
| [31] |
Li S, Zhang Q. Spatial characterization of dissolved trace elements and heavy metals in the upper Han River (China) using multivariate statistical techniques. Journal of Hazardous Materials, 2010, 176(1): 579-588. |
| [32] |
Jing L, Fadong L, Qiang L et al. Spatial distribution and sources of dissolved trace metals in surface water of the Wei River, China. Water Science & Technology, 2013, 67(4): 817. |
| [33] |
Wang Z, Sun R, Zhang H et al. Analysis and assessment of heavy metal contamination in surface water and sediments:A case study from Luan River, Northern China. Frontiers of Environmental Science & Engineering, 2015, 9(2): 240-249. |
| [34] |
Giri S, Singh AK. Risk assessment, statistical source identification and seasonal fluctuation of dissolved metals in the Subarnarekha River, India. Journal of Hazardous Materials, 2014, 265: 305-314. DOI:10.1016/j.jhazmat.2013.09.067 |
| [35] |
Saiful IM, Kawser AM, Mohammad R et al. Heavy metal pollution in surface water and sediment:A preliminary assessment of an urban river in a developing country. Ecological Indicators, 2015, 48: 282-291. DOI:10.1016/j.ecolind.2014.08.016 |
| [36] |
Devicć G, Sakan S, Đorđević D. Assessment of the environmental significance of nutrients and heavy metal pollution in the river network of Serbia. Environmental Science and Pollution Research, 2016, 23(1): 282-297. DOI:10.1007/s11356-015-5808-5 |
| [37] |
Simeonov V, Stratis JA, Samara C et al. Assessment of the surface water quality in Northern Greece. Water Research, 2003, 37(17): 4119-4124. DOI:10.1016/S0043-1354(03)00398-1 |
| [38] |
Lu N. Comprehensive benefits of tin ores. Geology and Exploration, 1980(4): 43. [鲁宁. 锡矿石的综合利用. 地质勘探, 1980(4): 43.] |
| [39] |
Deng AT. Opinions on reserves calculation of associated beneficial components of tungsten ore in central south China. Geology and Exploration, 1957(16): 4-5. [邓安太. 对中南钨矿伴生有益组份储量计算的意见. 地质与勘探, 1957(16): 4-5.] |
| [40] |
Peng Y, He JG, Zhang ZM et al. Eco-environmental dynamic monitoring and assessment of rare earth mining area in southern Ganzhou using remote sensing. Acta Ecologica Sinica, 2016, 36(6): 1676-1685. [彭燕, 何国金, 张兆明等. 赣南稀土矿开发区生态环境遥感动态监测与评估. 生态学报, 2016, 36(6): 1676-1685.] |
| [41] |
Dudka S, Adriano DC. Environmental impacts of metal ore mining and processing:A review. Journal of Environmental Quality, 1997, 26(3): 590-602. |
| [42] |
Wang F, Huang ZY, Wang XL et al. Ecological risk assessment of heavy metals in surrounding soils of tungsten ores:Comparison of different evaluation methods. Environmental Chemistry, 2015, 34(2): 225-233. [王斐, 黄益宗, 王小玲等. 江西钨矿周边土壤重金属生态风险评价:不同评价方法的比较. 环境化学, 2015, 34(2): 225-233. DOI:10.7524/j.issn.0254-6108.2015.02.2014061802] |
| [43] |
Franklin RSCE, Duis L, Brown R et al. Trace element content of selected fertilizers and micronutrient source materials. Communications in Soil Science and Plant Analysis, 2005, 36(11/12): 1591-1609. |
| [44] |
Krishna AK, Satyanarayanan M, Govil PK. Assessment of heavy metal pollution in water using multivariate statistical techniques in an industrial area:A case study from Patancheru, Medak District, Andhra Pradesh, India. Journal of Hazardous Materials, 2009, 167(1): 366-373. |
| [45] |
Kalogeropoulos N, Scoullos M, Vassilaki-Grimani M et al. Vanadium in particles and sediments of the northern Saronikos Gulf, Greece. Science of the Total Environment, 1989, 79(3): 241-252. DOI:10.1016/0048-9697(89)90340-9 |
| [46] |
Miller SLSM, Anderson MJ, Daly EP et al. Source apportionment of exposures to volatile organic compounds. I. Evaluation of receptor models using simulated exposure data. Atmospheric Environment, 2002, 36(22): 3629-3641. DOI:10.1016/S1352-2310(02)00279-0 |
 2018, Vol. 30


