(2: 温州大学生命与环境科学学院, 温州 325035)
(2: College of Life and Environmental Science, Wenzhou University, Wenzhou 325035, P. R. China)
温瑞塘河作为温州人民的母亲河,近几十年来,由于生活、工业、农业等污水长期大量直排入河,导致河道水质日益恶化,严重制约了温州市的经济和社会发展.根据温州市环境保护局发布的数据,2000年温瑞塘河水质满足Ⅳ类水要求的河段长度仅占15.0 %,Ⅴ类及劣Ⅴ类河段占85.0 %,许多河段水体发黑、发臭,失去了原有的作用.温瑞塘河日趋严峻的水环境态势,引起了社会广泛的关注,沿河百姓要求治理温瑞塘河的呼声十分强烈.自2000年开始,温州市政府对温瑞塘河开展了大规模的整治工作,目前水环境恶化的趋势已在一定程度上得到了遏制,但其水质污染问题并未从根本上得到解决[1-2]. 2010年的监测结果表明,温瑞塘河流经温州市区河网部分水质较差,大部分区域属于劣Ⅴ类水质,水质综合整治仍需加强;氨氮、总磷为温瑞塘河的主要污染物;塘河水质综合污染状况呈现城市重于郊区农村、旧城区重于新城区、支流重于干流的空间分布特征[1-2].
过量的营养元素为水华发生准备了物质条件, 近年来,在温瑞塘河局部区域发生的水华因导致水体颜色异常而时常引发市民恐慌.水华具有分布广、规模大和持续时间长的特点, 是人类淡水资源安全利用的重要威胁,也是世界范围内的研究热点[3-5].水华发生后会增加水体的浊度进而限制光在水体中的传递,这又会威胁大型水生植物和底栖大型藻类的生存[6-7].水华藻类在夜间的呼吸作用和细胞分解会消耗水体中的氧气,引起水体中鱼类和其他生物的死亡损失,而其释放的有害物质甚至威胁到人类安全[8-10].
浮游生物对环境变化反应敏感, 水质的变化可能影响其生理活动、种类丰度、种群密度、群落结构及功能[11-12].此外,浮游生物作为水生态系统的重要组成部分,其生态类群及丰度变化能够客观反映水体污染现状[5-7].太阳辐射的昼夜变化能够引起水温及水生植物光合作用的变化进而导致溶解氧呈现出典型的昼夜变化[13],而溶解氧和温度的昼夜变化进而又会导致营养盐昼夜变化[14-15].目前我国对于河流及湖泊水质、水华类型及强度和水生生物群落结构的研究主要体现在季节与年际变化尺度上[16-18].针对水环境及浮游植物类群的加密采样可以帮助找到那些对环境变化更敏感的水华指标,以便更加精准地预测富营养水体中水华发生的理化及生物条件,水华类型、发生规律及强度.为该水系生态问题的诊断及生态修复规划提供科学数据支撑,对巩固已取得的治理成果及进一步构建良性自循环的河道生态系统均有重要意义.
1 材料与方法 1.1 研究区概况温瑞塘河位于瓯江以南、飞云江以北的温瑞平原,是温州市境内十分重要的河道水系,分属于鹿城、瓯海、龙湾、瑞安等“三区一市”管辖.水源主要来自瞿溪、雄溪、郭溪(通称“三溪”)以及大罗山和集云山的山涧溪流,整个流域面积740 km2,水面面积22 km2,灌溉面积320 km2.该流域气候条件为亚热带季风气候,年平均降雨量1694.8 mm;年平均径流量9.13亿m3,水系河网总长度1178.4 km.温瑞塘河的水文特点是河水和河床的比降相当小甚至接近于零,河流流速十分缓慢,河流流向不定,经常出现逆流和滞流[1].
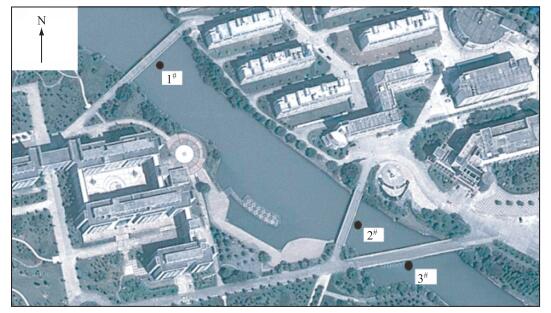
1.2 样品采集与分析选取了主河道下游3个采样站位(图 1),分别为样点1#(27°92′05″N, 120°69′44″E)、样点2#(27°91′93″N, 120°69′60″E)和样点3#(27°91′90″N, 120°69′65″E),样点1#与样点2#距离为218 m,样点1#与样点3#距离为273 m,样点2#与样点3#距离为60 m.本研究的目的在于通过加密采样,确定温瑞塘河浮游植物群落类型及其在每个月甚至是一天中的变化情况,所以选择的站位有限,采样点距离较近是因为该河段属于滞流河段,水文因素对结果影响较小;同时也是为了能够在较短时间内完成样品采集及对浮游植物类群、叶绿素a浓度及光合活性的测定.于2015年1-12月每月15日的7:00-18:00每隔1 h采1次水样,进行全年及当日白天时间的加密监测.如果当日是雨天则推迟到晴天再进行监测.
|
图 1 温瑞塘河采样点的设置 Fig.1 Location of the sampling sites in Wenruitang River |
各采样点水深在1.5~2.0 m之间,周围没有支流汇入.每个采样点用有机玻璃采水器于距离表层0.5 m处采集水样,用温度计现场测定温度.并且在岸边利用Phyto-PAM (Heinz Walz GmbH,Effeltrich,Germany)经校准后测定水体中的叶绿素a浓度及浮游植物的有效光合量子产率.水样在10 min内带回实验室, 利用碱性过硫酸钾消解紫外分光光度法(HJ 636-2012)测定总氮(TN)浓度;根据钼酸铵分光光度法(GB/T 11893-1989)测定总磷(TP)浓度.
1.3 水体叶绿素a浓度测定与浮游植物群落类型划分本研究采用具有对浮游藻类种群分类、活体叶绿素a浓度及光合活性检测功能的Phyto-PAM浮游植物分析仪(Heinz Walz GmbH,Effeltrich,Germany)测定水体的叶绿素a浓度,并对水体中的浮游植物按照蓝藻、绿藻、“褐藻”(实际上为硅藻+甲藻)种群进行群落类型的划分. Phyto-PAM中的一组发光二极管(LED)能产生毫秒级(μs)的测量光脉冲,其包括蓝光(470 nm)、绿光(520 nm)、浅红光(645 nm)和深红光(665 nm).当这些不同颜色的高频测量光脉冲交替作用于浮游植物细胞后,仪器能够获得这4种测量光脉冲所激发的叶绿素荧光同步信号.根据同步的叶绿素激发荧光信号就可以区分藻体中含有的不同天线色素,进而根据藻类所含天线色素成分及比例的差异把水体中的总浮游藻类划分为蓝藻、绿藻和“褐藻”(在后面部分均根据实际情况描述为硅藻)种群[19-20].
1.4 水体中浮游藻类有效光合量子产量的测定有效光合量子产率(Effective quantum yield, ΔF/Fm′)代表着浮游植物光系统Ⅱ (photosystem Ⅱ,PSII)的光化学反应效率,即光合活性[21-22].为了监测水体中不同类群浮游植物光合活性在不同月份的日变化模式,取水样3 ml,用Phyto-PAM浮游植物分析仪测定ΔF/Fm′. ΔF为光适应条件下的可变荧光,其为光适应状态下最大荧光(Fm′)和稳态荧光的(Ft′)的差值.
1.5 监测初期浮游植物优势种的确定为了解温瑞塘河段的浮游植物优势种,分别在1、4、7、10月用1000 ml有机玻璃采水器在水深0.5 m处采集水样1000 ml,现场加入15 ml鲁哥试剂并摇匀,带回实验室静置沉淀24 h后浓缩并定容至30 ml供镜检.浮游植物的计数用0.1 ml浮游植物计数框在10×40倍光学显微镜下进行.计数时充分摇匀浓缩液,然后立即取0.1 ml样品放入计数框中,观察100个视野(对量小而个体大的种类在10×10倍镜下全片计数).每个样品计数2片,取其平均值作为最终结果(若2片计数结果相差15 %以上,则进行第3片计数,取其中个数相近的2片的平均值).最后换算成每升水样中藻类的细胞数,即为细胞丰度(cells/L).)根据每种藻类的丰度及总浮游植物的丰度计算各种藻类的优势度:Y=Ni/N, 式中,ni为第i种浮游植物的丰度,Ni是该种浮游植物在各样点中浮游植物出现的频率,N为总丰度.取浮游植物优势度Y≥0.02的种为优势种[23].
1.6 数据分析利用均值±标准差(mean±SD)描述实验数据的数字特征,并采用单因素方差分析(One-way ANOVA)和LSD检验进行差异性分析,显著水平设定为P=0.05.数据处理及分析采用的软件为SPSS 19.0和Excel 2010,作图及曲线拟合软件为Origin 7.0.
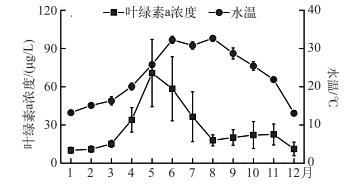
2 结果 2.1 温瑞塘河水体叶绿素a浓度和水温随时间的变化以调查当天温瑞塘河水体中叶绿素a浓度和水温的平均值代表当月的平均叶绿素a浓度和水温,结果显示2015年1月水体叶绿素a浓度最低,为10.08±2.41 μg/L;5月最高,为70.73±26.42 μg/L.水体叶绿素a浓度的总体变化趋势为春季(3-5月)>夏季(6-8月)>秋季(9-11月)>冬季(12-2月),4个季节叶绿素a浓度分别为39.98、37.62、21.59和10.74 μg/L(图 2).而最高和最低水温分别出现在8月和12月, 分别为32.67±0.73和13.08±0.42℃.四季的平均水温则是夏季>秋季>春季>冬季,分别为30.91、25.34、20.72和13.80℃(图 2).
|
图 2 2015年温瑞塘河表层水体叶绿素a浓度和水温的变化 Fig.2 Changes in chlorophyll-a concentration and temperature in the surface water of Wenruitang River in 2015 |
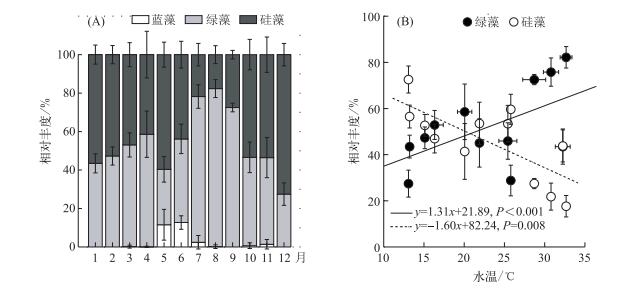
根据镜检结果,温瑞塘河浮游植物的生态类型几乎都为亚热带季风气候近岸性物种, 且硅藻在丰度上占优势.虽然每个季节的优势种丰度变化很大,但是其种类却没有变化.主要优势种(Y≥0.02)为颗粒直链藻极狭变种(Melodira granulata var. angustissima)、颗粒直链藻(M. granulata (Ehr.) Ralfs)、二角盘星藻纤细变种(Pediastrum duplex var. gracillimum)、二角盘星藻(P. duplex)、实球藻(Pandorina spp.)、新月藻(Closterium spp.)、梭形裸藻(Euglena acus Ehrenberg).以水体中不同类群浮游藻类种群即蓝藻、绿藻和硅藻所含叶绿素a含量与水体中总叶绿素a浓度的比值随时间变化表示各种群相对丰度在一年中的消长状况.结果发现温瑞塘河水体中的浮游植物群落结构全年以绿藻和硅藻(虽然Phyto-PAM检测的硅藻数据涵盖了甲藻,但是甲藻只是零星出现,并不是优势种)为主,蓝藻只在春末夏初出现,并且所占比例很低.其相对丰度在5、6月分别占总浮游植物生物量的11.55 % ±7.99 %和12.70 % ±3.48 % (图 3A);其他月份偶尔出现,且相对丰度均低于5 %,可忽略不计.在夏季绿藻种群占绝对优势,而在冬季硅藻种群占优势.绿藻种群在四季中的相对丰度分别为46.74 %、67.14 %、54.50 %和39.42 %,与水温呈正相关(图 3B).硅藻种群在四季相对丰度分别为49.33 %、27.75 %、44.82 %和60.58 %,与水温呈负相关(图 3B).因此,全年中温瑞塘河的浮游藻类群落类型为硅藻-绿藻型.
|
图 3 2015年温瑞塘河表层水体中蓝藻、绿藻和硅藻种群相对丰度的变化(A)及其与水温的关系(B) Fig.3 Changes in relative abundance of cyanobacteria, chlorophyta and diatoms in the surface water of Wenruitang River (A) and the relationship to water temperature (B) in 2015 |
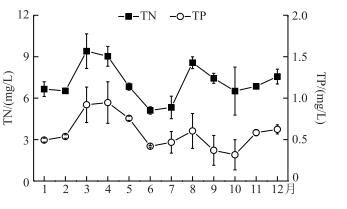
监测期间温瑞塘河表层水体TN和TP浓度均处于较高的水平. TN浓度为5.33~9.40 mg/L,平均值为7.15 mg/L;TP浓度为0.30~0.95 mg/L,平均值为0.59 mg/L.水体中的N/P比值为13.06(图 4). TN和TP浓度最大值均出现在春季,分别为8.42和0.87 mg/L; 最小值则分别出现在夏季和秋季, 分别为6.33和0.42 mg/L(图 4).根据坂本的水质营养程度分类标准[24], 温瑞塘河水体的营养程度为超富营养.
|
图 4 2015年温瑞塘河表层水体中总氮和总磷浓度的变化 Fig.4 Changes in total nitrogen and total phosphorus concentrations in the surface water of Wenruitang River in 2015 |
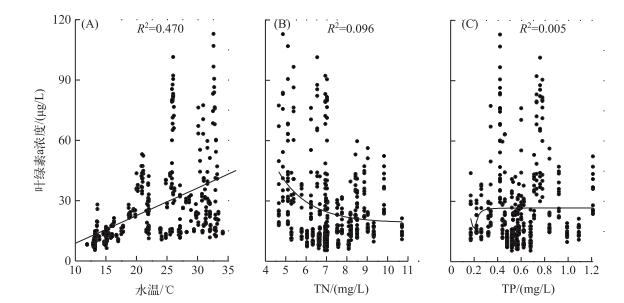
把全年的表层水体叶绿素a浓度与水温、氮磷浓度进行拟合以考察叶绿素a浓度与环境因子之间的相关性(图 5),结果发现温瑞塘河表层水体的叶绿素a浓度只与水温呈正相关(P < 0.05),而与TN和TP浓度均没有相关性(P>0.05).说明在温瑞塘河的富营养化水体中,氮、磷均不是各浮游藻类种群生长的限制因子,水温变化可能是调控藻类生长进而引发水华形成的首要环境因子.
|
图 5 2015年温瑞塘河水体中叶绿素a浓度与水温(A)、总氮(B)、总磷(C)浓度的对应关系 Fig.5 Relationships between total chlorophyll-a and water temperature(A), total nitrogen(B) and total phosphorus(C) in the surface water of Wenruitang River in 2015 |
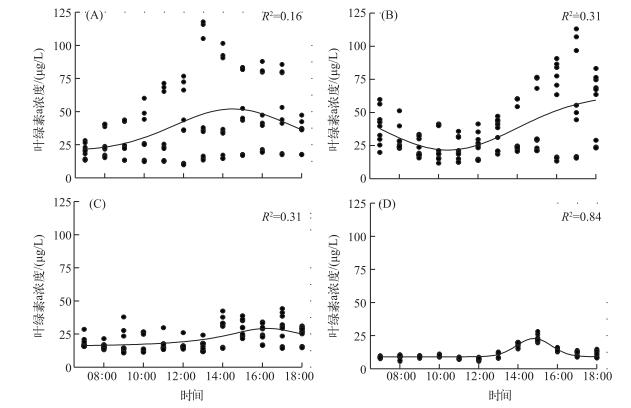
温瑞塘河水体中叶绿素a浓度不但在不同季节差别很大,在同一天中的不同时刻也波动很大,并且不同季节又呈现出不同的日变化模式.在春季,叶绿素a浓度上午呈缓慢上升的趋势,在下午2:00达到最大值,而后又开始缓慢下降(图 6A).到了夏季,表层水体中叶绿素a浓度则是从早到晚呈先下降再上升的趋势;在上午11:00到最低值,而后开始上升,持续到傍晚(图 6B).在秋季,水体中叶绿素a浓度在中午(12:00)之前没有明显的变化;之后开始上升并在16:00到达峰值,然后再缓慢降低(图 6C).冬季叶绿素a浓度最低,但是变化却最明显:其在中午之前几乎没有变化,但是之后急剧上升,并于15:00左右达到峰值,而后又迅速下降至上午时刻的较低水平(图 6D).
|
图 6 2015年春(A)、夏(B)、秋(C)、冬(D)四季中表层水体中总叶绿素a浓度的日变化 Fig.6 Diurnal changes of chlorophyll-a concentration in surface water of Wenruitang River in spring(A), summer(B), autumn(C) and winter(D) of 2015 |
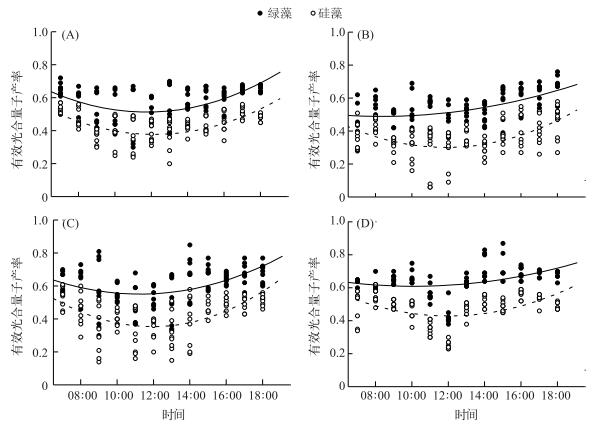
温瑞塘河表层水体中浮游植物有效光合量子产率的变化趋势在不同季节基本一致:均是先降低后升高(图 7),正好与典型晴天时一天中的日照强度变化相反.但是绿藻的有效光合量子产率均高于硅藻,且二者在夏季差别最大(图 7B).除了春季(图 7A)外,绿藻和硅藻全天的平均有效光合量子产率均存在显著差异(P < 0.05).
|
图 7 温瑞塘河表层水体中绿藻及硅藻种群有效光合量子产率在2015年春(A)、夏(B)、秋(C)、冬(D)季中的日变化 Fig.7 Diurnal changes in effective quantum yield of green algae and diatoms in the surface water of Wenruitang River in spring(A), summer(B), autumn (C) and winter(D) in 2015 |
硅藻、绿藻和蓝藻都是富营养水体中常见的优势种群,并且各种群丰度由于受营养盐和温度等环境因子的驱动而处于动态变化之中[25-28].在该研究中,温瑞塘河主要的浮游植物种群为绿藻和硅藻,蓝藻只在春夏之交出现,且相对丰度很小(图 3A).而温瑞塘河中的TN浓度为5.33±0.81~9.40±1.25 mg/L,TP浓度为0.32±0.18~0.95±0.25 mg/L(图 2), 已达劣Ⅴ类水平[24].有研究报道湖库水体中的氮、磷浓度分别达到1~4和0.1~0.3 mg/L时极易发生水华[29].而温瑞塘河的氮、磷浓度分别远高于该值,说明温瑞塘河完全具备水华发生的营养条件,氮、磷都不是限制因子.
温瑞塘河氮磷比值(N/P比值)为9.03~20.56,平均值为13.06±3.70(图 2),非常接近藻类健康生长及生理平衡所需的N/P比值(N/P原子比为16 :1),即所谓的Redfield比率[30-31],因此从N/P比值看也是适合水体中浮游藻类生长的.但需要指出的是当营养水平接近限制水平时,Redfield值是有效的[32-33];而当营养过剩时,水体中的N、P浓度会高于浮游植物的生长需求,从而导致N/P比值失去对浮游植物生长及生理活动的调控作用[3, 34].
不同种类藻细胞的元素组成存在着差异[35], 对各类营养物质的需求也不尽相同, 因此当一种浮游植物因某种营养盐缺乏而生长受限时,另一种对该营养盐要求较低的浮游植物可能会快速生长,进而形成优势种群.蓝藻在低N/P比值下容易成为优势种群,这主要与蓝藻对氮的竞争能力比其它藻类强有关.因为低N/P比值容易导致氮缺乏, 很多蓝藻种类能够固氮, 容易在低N/P比的湖泊中形成优势种[36].然而, 固氮蓝藻形成优势种的调控因素很多,不仅仅是低氮条件[37].例如在我国太湖、巢湖和滇池等湖泊中,夏季形成水华的蓝藻主要是没有固氮能力的微囊藻[4-6],其形成优势的机理就无法从低N/P比值导致蓝藻生物固氮方面来解释.而在营养盐浓度相对充分的情况下,绿藻比蓝藻生长更快[38].因此,蓝藻水华可能是湖泊富营养化过程中某阶段的产物,该阶段很可能是当水体中营养盐达到一定程度,但又不十分充分的情况下,其他藻类生长受限制,蓝藻因为某些生理上的优势,成为该阶段的优势种; 当水中营养盐继续增加,达到充分的情况下,原先具优势的蓝藻会逐渐失去竞争优势[37].此外,在营养盐充足的情况下,一些蓝藻对其它胁迫因子如H2O2和敌草快(一种接触性除草剂)比绿藻和硅藻更为敏感[39-40].而温瑞塘河是一个重度污染的平原河流,水体含有各种有害物质[41].这些有害物质的存在可能是导致温瑞塘河水体蓝藻优势地位丧失,浮游藻类群落全年都是以绿藻-硅藻型种群为主的主要原因.另外,在一些富营养化湖库中,硅藻和绿藻常常从优势种群发展为水华[42-43],而在温瑞塘河中,大量氮、磷营养的存在可能使得所有种类浮游植物的生长均已不再受营养盐的限制(图 5B、C),而且硅藻和绿藻种群常年占优势(图 3),因此该河段发生硅藻及绿藻水华的风险较大.
营养盐浓度较低的情况下,水体中营养盐增加会导致藻类生物量显著增加[6, 44],但是在富营养化和超富营养化湖泊中浮游藻类的生物量与水体中的营养盐浓度之间并不具有显著的相关性[45-46].而在温瑞塘河中,水体叶绿素a浓度在任何季节均与水体中的氮、磷浓度没有相关性(图 5B、C),温瑞塘河水体的超富营养状况可能是造成水体叶绿素a浓度只与水温呈正相关(图 5A),而与氮、磷浓度均无相关性(图 5B、C)的主要原因.绿藻的最适生长温度通常高于硅藻[47-48].据报道,在淡水系统中,当温度从10℃升高至30℃时,浮游植物类群通常由硅藻种群转变为绿藻种群[49].这可能也是绿藻在夏季占绝对优势而硅藻在冬季占优势的主要原因(图 2).
通过监测野外采集水样的叶绿素a浓度是判断水体中的浮游植物丰度时空分布及水华生消过程的常用方法.但是在本研究中,我们发现在一天中的不同时刻同一样点采集的水样,其叶绿素a浓度差别很大,并且不同季节的叶绿素a浓度在一天中又呈现不同的变化模式(图 6).这可能是由于浮游植物因为自身含有气泡结构以及受光合产物合成速度的影响,能够改变自身比重,从而实现在水体的垂直迁移[22, 50].其次,有些浮游植物细胞因本身具有鞭毛而具有一定的运动能力,这使得其在温瑞塘河的滞流水体中能根据一天中阳光辐射强度变化及自身趋光特性改变其在水体中位置[51-52].温瑞塘河属于超富营养且水流滞缓的平原河流,其水文状况与大部分富营养程度严重的浅水湖非常类似,鉴于其水体中的叶绿素a浓度在不同季节甚至同一天中的不同时刻都可能存在很大的差异(图 6).因此在水流滞缓的河道及小型湖泊进行调查取样时,应尽可能考虑时间及天气状况等因素的影响,争取在较小的时间段和类似的天气条件完成水样采集,以减少不同天气状况引起的数据偏差.
与叶绿素a浓度的日变化模式不同,温瑞塘河水体中浮游植物有效光合量子产率在不同季节的日变化模式都非常类似(图 7).这种变化恰好与一天中日照强度变化相反,应该是太阳辐射强度变化对浮游藻类光系统Ⅱ(PSII)损伤造成的[22, 48].此外,由于在不同季节,绿藻种群的有效光合量子产率均高于(P < 0.05)硅藻种群,说明浮游藻类的光合量子产率具有种类依赖性.而浮游藻类的有效光合量子产率在任何季节都是中午降至最低,并且与早上(8:00)及傍晚(18:00)时刻的测量值均存在显著差异(P < 0.05),也说明了这些浮游藻类具有需要通过在水体中进行垂直迁移而躲避强光损伤的内在需求.
3 结论总之,温瑞塘河水质属于超富营养状态,全年叶绿素a浓度均高于10 μg/L,春、夏季接近40 μg/L,达到中等程度水华水平.水体的叶绿素a浓度只与水温呈正相关,而与TN和TP浓度没有相关性.浮游藻类群落类型为硅藻-绿藻型,全年以绿藻类和硅藻类群浮游植物为主,蓝藻种群只出现在春末夏初,并且所占比例很低.绿藻在夏季占绝对优势,其相对丰度与水温呈正相关;硅藻在冬季占优势,其相对丰度与水温呈负相关.叶绿素a浓度不但随季节差别很大,在一天的不同时刻也差别很大,并且不同的季节又呈现出不同的日变化模式.表层水体中浮游植物有效光合量子产率的变化在不同季节基本一致:均呈现先降低后升高的趋势且绿藻种群的有效光合量子产率均高于硅藻种群.因此温瑞塘河具备发生各类水华的营养条件,但是发生有害蓝藻水华的概率并不高.温度是影响水体叶绿素a浓度季节变化的主要因素,而日照则可能是影响各类群浮游植物光合量子产率的主要因素.
| [1] |
Ji XL, Li PC, Shang X et al. Diurnal variation and evaluation of water quality of the Wenruitang River in spring. Environmental Chemistry, 2013, 32(11): 2082-2089. [纪晓亮, 李鹏程, 商栩等. 春季温瑞塘河水质的昼夜变化规律及评价. 环境化学, 2013, 32(11): 2082-2089. DOI:10.7524/j.issn.0254-6108.2013.11.010] |
| [2] |
Zhu HM, Chen Q, Wang ZF et al. Development of water quality evaluation model for urban river networks based on GIS raster data. Journal of Environmental Health, 2015, 32(1): 54-57. [朱慧敏, 陈强, 王振峰等. 基于GIS栅格数据的城市河网水质综合评价模型构建. 环境与健康杂志, 2015, 32(1): 54-57.] |
| [3] |
Paerl HW, Fulto RS, Moisander PH et al. Harmful freshwater algal blooms, with an emphasis on cyanobacteria. Scientific World Journal, 2001(1): 76-113. |
| [4] |
Paerl HW, Hai X, McCarthy MJ et al. Controlling harmful cyanobacterial blooms in a hyper-eutrophic lake (Lake Taihu, China):The need for a dual nutrient (N & P) management strategy. Water Research, 2011, 45: 1973-1983. DOI:10.1016/j.watres.2010.09.018 |
| [5] |
Qin B, Zhu G, Gao G et al. A drinking water crisis in Lake Taihu, China:linkage to climatic variability and lake management. Environmental Management, 2010, 45: 105-112. DOI:10.1007/s00267-009-9393-6 |
| [6] |
Jeppesen E, Peder Jensen J, Søndergaard M et al. Trophic structure, species richness and biodiversity in Danish lakes:changes along a phosphorus gradient. Freshwater Biology, 2000, 45: 201-218. DOI:10.1046/j.1365-2427.2000.00675.x |
| [7] |
Scheffer M, Straile D, van Nes EH et al. Climatic warming causes regime shifts in lake food webs. Limnology and Oceanography, 2001, 46: 1780-1783. DOI:10.4319/lo.2001.46.7.1780 |
| [8] |
Watkinson AJ, O'Neil JM, Dennison WC. Ecophysiology of the marine cyanobacterium Lyngbya majuscule (Oscillatoriaceae) in Moreton Bay, Australia. Harmful Algae, 2005, 4: 697-715. DOI:10.1016/j.hal.2004.09.001 |
| [9] |
Garcia R, Johnstone RW. Effects of Lyngbya majuscule(Cyanophycea) blooms on sediment nutrients and meiofaunal assemblages in seagrass beds in Moreton Bay, Australia. Marine and Freshwater Research, 2006, 57: 155-165. DOI:10.1071/MF05053 |
| [10] |
Paerl HW, Fulton Ⅲ RS. Ecology of harmful cyanobacteria. In: Graneli E, Turner J eds. Ecology of harmful marine algae. Berlin: Springer-Verlag, 2006: 95-107.
|
| [11] |
Dai GY, Li J, Li L et al. The spatio-temporal pattern of phytoplankton in the north basin of Lake Dianchi and related environmental factors. Acta Hydrobiologica Sinica, 2012, 36(5): 946-956. [代龚圆, 李杰, 李林等. 滇池北部湖区浮游植物时空格局及相关环境因子. 水生生物学报, 2012, 36(5): 946-956.] |
| [12] |
Sun ZQ, Shi XL, Xu LL et al. The protozoan community structure and its response to the change of water quality in a typical wetland landscape in summer. Acta Hydrobiologica Sinica, 2013, 37(2): 290-299. [孙志强, 施心路, 徐琳琳等. 景观湿地夏季原生动物群落结构与水质关系. 水生生物学报, 2013, 37(2): 290-299. DOI:10.7541/2013.17] |
| [13] |
David A, Nimick Gammons CH, Parker SR. Diel biogeochemical processes and their effect on the aqueous chemistry of streams:A review. Chemical Geology, 2011, 283(1/2): 3-17. |
| [14] |
Brick CM, Moore JN. Diel variation of trace metals in the upper Clark Fork River, Montana. Environmental Science & Technology, 1996, 30(6): 1953-1960. |
| [15] |
Seitzinger SP, Kroeze C. Global distribution of nitrous oxide production and N inputs in freshwater and coastal marine ecosystems. Global Biogeochemical Cycles, 1998, 12: 93-113. DOI:10.1029/97GB03657 |
| [16] |
Negro AI, Hoyos CD, Vega J. Phytoplankton structure and dynamics in Lake Sanabria and Valparaiso reservoir (NW Spain). Hydrobiologia, 2000, 424: 25-37. DOI:10.1023/A:1003940625437 |
| [17] |
Kamenir Y, Dubinsky Z, Zohary T. Phytoplankton size structure stability in a meso-eutrophic subtropical lake. Hydrobiologia, 2004, 520: 89-104. DOI:10.1023/B:HYDR.0000027729.53348.c7 |
| [18] |
Wang XQ, Zeng YY, Wu HH et al. Investigation on plankton communication and water quality state in the mainstream of Xiangjiang River. Acta Hydrobiologica Sinica, 2013, 37(3): 488-494. [王晓清, 曾亚英, 吴含含等. 湘江干流浮游生物群落结构及水质状况分析. 水生生物学报, 2013, 37(3): 488-494. DOI:10.7541/2013.49] |
| [19] |
Ma Z, Fang T, Thring RW et al. Toxic and non-toxic strains of Microcystis aeruginosa induce temperature dependent allelopathy toward growth and photosynthesis of Chlorella vulgaris. Harmful Algae, 2015, 48: 21-29. DOI:10.1016/j.hal.2015.07.002 |
| [20] |
Schreiber U, Endo T, Mi H et al. Quenching analysis of chlorophyll fluorescence by the saturation pulse method:particular aspects relating to the study of eukaryotic algae and cyanobacteria. Plant and Cell Physiology, 1995, 36: 873-882. DOI:10.1093/oxfordjournals.pcp.a078833 |
| [21] |
Kolber Z, Falkowski PG. Use of fluorescence to estimate phytoplankton photosynthesis in situ. Limnology and Oceanography, 1993, 38: 1646-1665. DOI:10.4319/lo.1993.38.8.1646 |
| [22] |
Ma Z, Gao K. Photosynthetically active and UV radiation act in an antagonistic way in regulating buoyancy of Arthrospira (Spirulina) platensis (cyanobacterium). Environmental and Experimental Botany, 2009, 66: 265-269. DOI:10.1016/j.envexpbot.2009.02.006 |
| [23] |
Xu ZL, Chen YX. Aggregated intensity of dominant species of zooplankton in autumn in the East China Sea and Yellow Sea. Chinese Journal of Ecology, 1989, 8(4): 13-15. [徐兆礼, 陈亚衢. 东黄海秋季浮游动物优势种聚集强度与鲐参渔场的关系. 生态学杂志, 1989, 8(4): 13-15.] |
| [24] |
Liu QX, Zhang SY. Studies on the physical and chemical character of the water in Donghu Lake. In: Liu JK ed. The study on ecology in Donghu Lake (Ⅰ). Beijing: Science Press, 1990: 10-51. [刘衢霞, 张水元. 湖水的理化性质. 见: 刘建康编. 东湖生态学研究(一). 北京: 科学出版社, 1990: 10-51. ]
|
| [25] |
Wan L, Zhu W, Zhao LF. Effect of nitrogen and phosphorus on growth and competition of M. aeruginosa and S. quadricauda.. Environmental Science, 2007, 28(6): 1230-1235. [万蕾, 朱伟, 赵联芳. 氮磷对微囊藻和栅藻生长及竞争的影响. 环境科学, 2007, 28(6): 1230-1235.] |
| [26] |
Xia S, Zhang Q, Liu GX et al. Ecological influences of phytoplankton community in an experimental man-made lake. Acta Hydrobiologica Sinica, 2013, 37(4): 640-647. [夏爽, 张琪, 刘国祥等. 人工试验湖泊浮游藻类群落的生态学研究. 水生生物学报, 2013, 37(4): 640-647. DOI:10.7541/2013.75] |
| [27] |
Elliott JA. The seasonal sensitivity of cyanobacteria and other phytoplankton to changes in flushing rate and water temperature. Global Change Biology, 2010, 16(2): 864-876. DOI:10.1111/gcb.2010.16.issue-2 |
| [28] |
Salmaso N, Buzzi F, Garibaldi L et al. Effects of nutrient availability and temperature on phytoplankton development:A case study from large lakes south of the Alps. Aquatic Sciences, 2012, 74(3): 555-570. DOI:10.1007/s00027-012-0248-5 |
| [29] |
Chen J, Quan WT, Sun JH. Relationship between nitrogen, phosphorus concentration and water quality Factors. Environmental Monitoring in China, 2011, 27(3): 79-83. [陈军, 权文婷, 孙记红. 太湖氮磷浓度与水质因子的关系. 中国环境监测, 2011, 27(3): 79-83.] |
| [30] |
Redfield AC. The biological control of chemical factors in the environment. American Scientist, 1958, 46: 205-222. |
| [31] |
Klausmeier CA, Litchman E, Daufresne T et al. Optimal nitrogen to phosphorus stoichiometry of phytoplankton. Nature, 2004, 429: 171-174. DOI:10.1038/nature02454 |
| [32] |
Schindler DW. Evolution of phosphorus limitation in lakes. Science, 1977, 195: 260-262. DOI:10.1126/science.195.4275.260 |
| [33] |
Smith VH. Low nitrogen to phosphorus ratios favor dominance by blue-green algae in lake phytoplankton. Science, 1983, 225: 669-671. |
| [34] |
Trimbee AM, Prepas EE. Evaluation of total phosphorus as a predictor of the relative biomass of blue-green algae with emphasis on Alberta lakes. Canadian Bulletin of Fisheries and Aquatic Sciences, 1987, 14: 1337-1442. |
| [35] |
Hodgkiss IJ, Lu SH. The effects of nutrients and their ratios on phytoplankton abundance in Junk Bay, Hong Kong. Hydrobiologia, 2004, 512(1): 215-229. |
| [36] |
Huisman J, Hulot F. Population dynamics of harmful cyanobacteria: Factors affecting species composition. In: Huisman J, Matthijs HCP, Visser PM eds. Harmful cyanobacteria. Berlin: Springer, 2005: 143-176.
|
| [37] |
Qin BQ. Approaches to mechanisms and control of eutrophication of shallow lakes in the middle and lower reaches of the Yangze River. J Lake Sci, 2002, 14(3): 193-202. [秦伯强. 长江中下游浅水湖泊富营养化发生机制与控制途径初探. 湖泊科学, 2002, 14(3): 193-202. DOI:10.18307/2002.0301] |
| [38] |
Chen YW, Qin BQ, Teubner K et al. Long-term dynamics of phytoplankton assemblages:Microcystis-domination in Lake Taihu, a large shallow lake in China. Journal of Plankton Research, 2003, 25(4): 445-453. DOI:10.1093/plankt/25.4.445 |
| [39] |
Peterson HG, Boutin C, Freemark KE et al. Toxicity of hexazinone and diquat to green algae, diatoms, cyanobacteria and duckweed. Aquatic Toxicology, 1997, 39(2): 111-134. DOI:10.1016/S0166-445X(97)00022-2 |
| [40] |
Harel M, Weiss G, Lieman-Hurwitz J et al. Interactions between Scenedesmus and Microcystis may be used to clarify the role of secondary metabolites. Environmental Microbiology Reports, 2013, 5: 97-104. DOI:10.1111/emi4.2013.5.issue-1 |
| [41] |
Ma XX, Wang LC, Liao LL. Spatio-temporal characteristics and source identification of water pollutants in Wenruitang River. Environmental Science, 2015, 36(1): 64-71. [马小雪, 王腊春, 廖玲玲. 温瑞塘河流域水体污染时空分异特征及污染源识别. 环境科学, 2015, 36(1): 64-71.] |
| [42] |
Ibelings BW, Gsell AS, Mooij WM et al. Chytrid infections and diatom springblooms:Paradoxical effects of climate warming on fungal epidemics in lakes. Freshwater Biology, 2011, 56: 754-766. DOI:10.1111/fwb.2011.56.issue-4 |
| [43] |
Garg J, Gard HK. Nutrient loading and its consequences in a lake ecosystem. Tropical Ecology, 2002, 43: 355-358. |
| [44] |
Vadeboncoeur Y, Lodge D, Carpenter S. Whole-lake fertilization effects on distribution of primary production between benthic and pelagic habitats. Ecology, 2001, 82: 1065-1077. DOI:10.1890/0012-9658(2001)082[1065:WLFEOD]2.0.CO;2 |
| [45] |
Lalonde S, Downing JA. Epiphyton biomass is related to lake trophic status, depth, and macrophyte architecture. Canadian Journal of Fisheries and Aquatic Sciences, 1991, 48: 2285-2291. DOI:10.1139/f91-268 |
| [46] |
Duan H, Ma R, Xu X. Two-decade reconstruction of algal blooms in China's Lake Taihu. Environmental Science & Technology, 2009, 43: 3522-3528. |
| [47] |
Gómez PI, Gonzálezt MA. The effect of temperature and irradiance on the growth and carotenogenic capacity of seven strains of Dunaliella salina (Chlorophyta) cultivated under laboratory conditions. Biological Research, 2005, 38: 151-162. |
| [48] |
Guo H, Yao J, Sun Z et al. Effect of temperature, irradiance on the growth of the green alga Caulerpa lentillifera (Bryopsidophyceae, Chlorophyta). Journal of Applied Phycology, 2015, 27: 879-885. DOI:10.1007/s10811-014-0358-7 |
| [49] |
Reynolds CS. What factors influence the species composition of phytoplankton in lakes of different trophic status. Hydrobiologia, 1998, 369: 11-26. |
| [50] |
Häder DP, Helbling EW, Williamson CE et al. Effects of UV radiation on aquatic ecosystems and interactions with climate change. Photochemical and Photobiological Sciences, 2011, 10(2): 242-260. DOI:10.1039/c0pp90036b |
| [51] |
Ma ZL, Helbling EW, Li W et al. Motility and photosynthetic responses of the green microalga Tetraselmis subcordiformis to visible and UV light levels. Journal of Applied Phycology, 2012, 24: 1613-1621. DOI:10.1007/s10811-012-9822-4 |
| [52] |
Richter PR, Häder DP, Gonçalves RJ et al. Vertical migration and motility response in three marine phytoplankton species exposed to solar radiation. Photochemistry and Photobiology, 2007, 83: 810-817. DOI:10.1111/j.1751-1097.2007.00076.x |
 2018, Vol. 30

