(2: 中国科学院大学, 北京 100049)
(2: University of Chinese Academy of Sciences, Beijing 100049, P. R. China)
高寒湖泊是青藏高原地表系统的重要组成部分,因受人类影响小、多处于自然状态,能更加敏感、真实地反映自然气候变化[1].与周边陆地相比,湖泊具有反照率低、粗糙度小和比热容大等特点,导致其储存更多太阳辐射、对气温变化起缓冲作用[2],并影响区域气候[3].如湖泊和陆地热力差异所激发的局地热力环流影响着流域内的大气环境以及污染物的输送[4],湖泊提供充分水汽、增强下游降水等[5-6].上述影响主要通过湖泊和大气间的相互作用实现,而大气湍流活动则是湖—气相互作用的主要方式.因此,对高寒湖泊大气湍流的直接观测及分析具有重要意义.
涡动相关法是直接测量地表湍流通量的方法,通过高频(~10 Hz)观测垂直风速和研究变量(如CO2和H2O),计算两者脉动协方差得到通量[6].相比其他方法,涡动相关法既不是建立在经验关系基础之上,亦不是从其他气象参量推论出来,在计算过程中几乎不存在任何假设.国内已报道的内陆湖泊涡动相关观测主要集中在太湖[7-9]、鄱阳湖[10-11]、纳木错[12-13]、洱海[14]和巴丹吉林沙漠湖泊[15].高时间分辨率的通量直接观测丰富了对湖—气相互作用过程的认识,如影响感热和潜热通量日变化的主控因素分别是湖—气温差和饱和水汽压差[14, 16];湖面感热和潜热通量日变化峰值分别出现在清晨和下午,而非太阳辐射最强的正午[8, 11, 16],主要得益于水体热储量释放[17];在小时尺度上,风速主导湍流热交换变化[13],影响蒸发的主要因子为风速、饱和水汽压差的乘积,而非净辐射[17-18].
湍流运动是大气边界层的本质特征[19],尤其在大气边界层底层——近地层,科氏力与气压梯度力的作用相对湍流切应力可忽略,大气结构主要依赖垂直湍流输送[20].近地层湍流研究中,验证Monin-Obukhov相似理论[21]的适用性是认识地-气相互作用的重要前提.已有研究证实[22-24],高原地区近地层风速等变量满足类似平原地区所得“1/3”和“-1/3”次幂律,垂直风速的相似性优于水平风速[25];温度、湿度仅在不稳定层结下服从幂律,稳定层结下则关系消失[26-27].尽管Monin-Obukhov相似理论是普适的,不同地区或下垫面湍流发展的强弱规律符合相似性的程度以及普适函数系数取值均存在较大差异性.并且,利用所获相似关系和拟合系数,可进一步通过“通量-方差法”估算湍流通量、填补因风速观测无效而引起的通量数据空白[18, 28].因此,分析和验证湍流相似性有重要意义.此外,高原对大气的热力及动力效应是由近地层与边界层逐渐影响到自由大气,故对高原边界层微气象特征的分析研究尤为重要[25].已有关于湍流宏观统计特征量的研究多集中于湍流强度、湍流动能的数值分布及其与风速、稳定度的关系[24, 29],以及动量、热通量变化规律和成因等方面[14, 30-31].基于涡动相关观测系统,已在高原多地区陆地下垫面开展近地层湍流特征研究,而湖泊下垫面报道相对较少,仅限于青海湖[32]、色林错[31]、鄂陵湖[33]及纳木错[12-13]等,对高原南部湖泊的近地层湍流特征研究更是未涉及,亟待扩展和加强高原湖泊大气湍流的观测分析和深入探究.
羊卓雍错位于青藏高原南部,是雅鲁藏布江南岸和喜马拉雅山北麓最大的内陆湖泊.最近10年该湖泊面积萎缩[34]、水位急剧下降,大片湖床出露,已威胁到湖区及周围农牧民生产生活和生态环境安全,引起当地政府高度重视.目前亟需对该湖泊水热循环及气候环境效应方面开展综合研究.然而自然环境严酷导致的观测数据匮乏成为羊卓雍错湖泊研究的瓶颈. 2016年3月,本研究组在该湖泊安装涡动相关系统开展长期定点观测.本文旨在利用2016和2017年4 —10月所获涡动观测资料,分析湖面大气湍流方差统计特征,验证边界层相似理论在该湖泊的适用性,分析湍流强度、湍流动能和湍流通量的统计和变化规律,以期增进对高原湖泊边界层湍流交换规律的认识,为改进高原湖泊气候模型参数化方案和进一步研究高寒湖泊水热循环过程提供基础数据和理论支撑.
1 资料与方法 1.1 观测仪器和数据预处理羊卓雍错流域海拔4400 m以上,属藏南山地灌丛草原半干旱气候,多年平均气温和降水量分别为2.9 ℃和365.7 mm(根据浪卡子气象站1961 —2014年记录). EC3000开路涡动相关系统架设在流域白地水文站旁边的湖岸浅水区(29°07′28″N,90°26′27″E),海拔4420.6 m.主体仪器是IRGASON涡动相关(Campbell Scientific,USA),2016和2017年安装朝向角分别为正北顺时针170°和178°,距水面2.1 m(安装时),主要采集数据有三维风速、超声虚温、气压、水汽密度和CO2密度,采集频率为10 Hz.选配仪器包括空气温湿度传感器(HMP155A,Campbell Scientific,USA)、四分量净辐射传感器(CNR4,Kipp & Zonen,Netherlands)、红外温度传感器(SI-111,Apogee,USA)和雨量筒(TE525MM,Campbell Scientific,USA),测量气温、相对湿度、辐射四分量、湖面温度(由红外温度传感器直接观测)和降水量等指标,由数据采集器(CR3000-NB-XT,Campbell Scientific,USA)处理成30 min平均值并储存.数据记录时间为北京时间,根据经度差,分析要素日变化时减去2 h换算为本地时间.
资料收集跨度为2016和2017年4 —10月,使用美国LI-COR公司研发的EddyPro 6.1软件(Eddy covariance processing software,http://www.licor.com/eddypro)进行处理,平均时间取30 min.主要处理包括:二次坐标旋转修正、WPL密度修正、超声虚温修正及高、低通滤波修正等[35].涡动相关法的应用主要基于3个假设(稳态、地形平坦、下垫面性质均匀一致)[36],而实际观测条件往往无法满足.因此,观测数据包含有湍流不平稳性以及偏离湍流特征的无效数据,需要对其进行质量控制.本文采取Foken等提出的质量控制方法,包括湍流平稳性检验、湍流发展充分性检验[36].当EddyPro软件输出30 min动量、感热和潜热通量的同时,伴随输出相应总质量级标记:“0”代表高质量通量,可用于基础研究,如参数化方案的发展;“1”代表中等质量数据,可用于长期观测资料处理;“2”代表低质量数据,本文予以剔除处理.
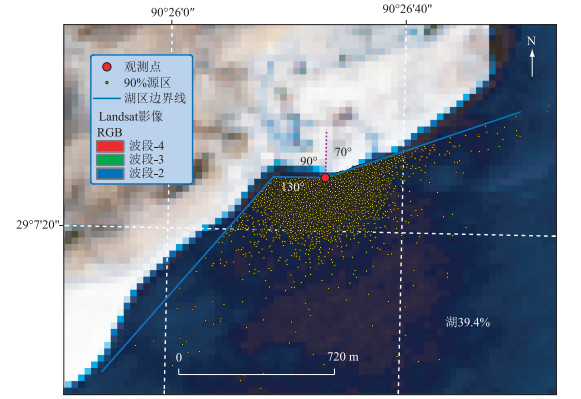
1.2 湖面源区划分涡动相关仪器为定点观测,能反映周围整个观测区域状况.通量贡献区是指对观测点湍流交换有贡献的有效源(汇)区域,即对观测点通量大小产生主要影响的表面区域[37].本文使用Kljun通量源区模型[38]进行源区分析,该模型是基于尺度(量纲)分析衍生的新颖算法,主要用来计算通量足迹的侧风积分函数.根据2016年3月26日Landsat 8遥感影像,结合由EddyPro输出的累积90 %通量贡献率区域至观测点的距离,本文取观测点70°~180°、观测点向东240 m处90°~130°范围代表湖泊通量源(图 1).经统计,表征湖泊通量源的频次为7471,占观测时段(2016年和2017年4 —10月)的39.4 %.
|
图 1 2016和2017年4 —10月羊卓雍错湖面通量源区分布(黄色点代表累积90 %通量贡献的远端点,背景为Landsat 8卫星遥感影像波段4、3、2组合,时间为2016年3月26日) Fig.1 Distribution of flux source area in Yamzhog Yumco during April-October 2016 and 2017 (The yellow points denote the distal points of the along-wind distance providing 90 % (cumulative) contribution to turbulent fluxes; The background is Landsat 8 satellite image (bands 4, 3 and 2) on March 26th, 2016) |
湍流强度(I)反映风的脉动强度,三维风分量的湍流强度分别表示为:
| $ {I_{\rm{u}}} = {\sigma _{\rm{u}}}/U, {I_{\rm{v}}} = {\sigma _{\rm{v}}}/U, {\rm{ }}{I_{\rm{w}}} = {\sigma _{\rm{w}}}/U $ | (1) |
式中,
湍流动能(TKE,m2/s2)是湍流强度的量度,直接关系边界层大气动量、热量及水汽等属性的输送,定义为[39]:
| $ TKE = (\sigma _u^2 + \sigma _v^2 + \sigma _w^2)/2 $ | (2) |
式中,σu2、σv2、σw2是三维风速瞬时量的方差(m2/s2).
1.3.3 湍流通量涡动相关法是根据微气象学原理,计算垂直风速脉动量与有关物理要素脉动量的协方差获取湍流通量. EddyPro计算动量通量(τ,kg/(m·s2))、感热通量(H,W/m2)和潜热通量(λE,W/m2)的方法为[35]:
| $ \left\{ \begin{array}{l} \;\;\;\;\;\tau = {\rho _{\rm{a}}}u_*^2\\ H = {\rho _{\rm{a}}}{C_{\rm{P}}}\overline {w'{T_{\rm{s}}}^\prime } \\ \lambda E = \lambda \overline {w'{{d'}_{{{\rm{H}}_{\rm{2}}}{\rm{O}}}}} \end{array} \right. $ | (3) |
式中,
在近地层相似理论中,近地层湍流发展的强弱规律符合Monin-Obukhov相似性理论.近地层风速分量(u、v、w)、超声虚温(Ts)、水汽密度(dH2O)和CO2密度(dCO2)的标准差被其特征尺度参数标准化(即无量纲化)后,可以用大气静力稳定度(ζ)的普适函数表示.多数研究证实,u、v、w的无量纲化标准差(σx/|X*|)随ζ的变化符合Panofsky等[40]给出的“1/3”次幂规律;对于Ts、dH2O、dCO2,本文通过数据拟合,发现其函数式较符合Tillman[41]给出的关系式;另外,无量纲湍流动能(TKE/u*2)与ζ也存在与风速分量类似的表达.各式表达如下:
| $ \left\{ \begin{array}{l} {\sigma _{x1}}/\left| {{X_*}} \right| = {C_1}{(1 \pm {C_2}\zeta )^{\frac{1}{3}}}\\ {\sigma _{x2}}/\left| {{X_*}} \right| = {C_3}{({C_4} \pm \zeta )^{ - \frac{1}{3}}}\\ TKE/u_*^2 = {C_5}{(1 \pm {C_6}\zeta )^{\frac{1}{3}}} \end{array} \right. $ | (4) |
式中,σx1、σx2分别为参数x1=(u、v、w)、x2=(Ts、dH2O、dCO2)的标准差,X*为各参数对应的特征尺度(u*、t*、h*、c*):
| $ \zeta = \frac{{z - d}}{L} $ | (5) |
式中,z为观测高度,取2.1 m,忽略4 —10月间湖水位的变化;d为零平面位移高度,取0 m;L是Obukhov长度,是表征稳定度的一个特征参数,计算式为[35]:
| $ L = - \frac{{{T_{\rm{p}}}u_*^3}}{{\kappa g\overline {w'{T_{\rm{s}}}^\prime } }} $ | (6) |
其中,κ=0.41,g=9.81 m/s2,Tp=Ta(105/Pa)0.286,Ta和Pa分别为环境温度(K)和压强(Pa).
本文选取1stOpt软件平台(7D-Soft High Technology Inc.,http://1stopt.software.informer.com/)“麦夸特法(Levenberg-Marquardt,LM)+通用全局优化算法(Universal Global Optimization,UGO)”对观测数据相似性关系进行拟合.该算法是解非线性方程的首选算法,求解能力总体上较其他算法强.
2 结果分析 2.1 观测点主风向及大气稳定度图 2a给出了2016和2017年4 —10月来自羊卓雍错湖面方向的风玫瑰图.主风向为WSW(占20.3 %),其次为SW(15.9 %).湖泊大气平均压强为601.9 hPa、温度为8.8℃、相对湿度为52.0 %.大气静力稳定度小于0的时刻高达81.8 %,其概率密度分布呈准正态、向负x轴偏移(图 2b),峰值在-0.05~0区间(占37.1 %).稳定度的正负值频次存在日变化,上午大气不稳定的频次明显偏多(图 2c).
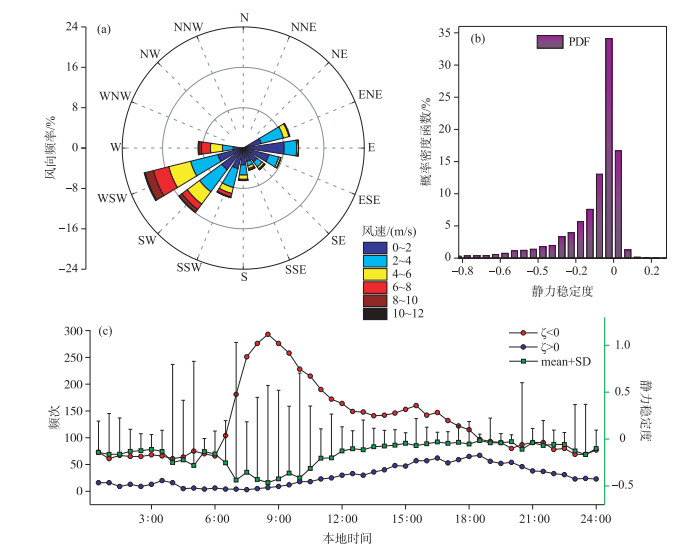
|
图 2 2016年和2017年4 —10月羊卓雍错湖面风速风向玫瑰图(a)、静力稳定度的概率密度函数(b)及日变化(c) Fig.2 The distribution of wind speed and direction (a), the probability density function (b), and the diurnal variations (c) of stability in Yamzhog Yumco during April-October 2016 and 2017 |
不稳定层结下,风速分量(u、v、w)和标量(Ts、dH2O、dCO2)无量纲标准差(σu/|u*|、σv/|u*|、σw/|u*|、σt/|t*|、σh/|h*|、σc/|c*|)随稳定度(ζ)的变化均符合“1/3”或“-1/3”次幂律(公式4)(图 3).其中w的拟合效果最好,拟合曲线与原标准差数据的相关系数达0.89;dCO2拟合效果相比较差(相关系数为0.23).不稳定层结下各变量的最优拟合表达式为:
| $ \left( {\zeta < 0} \right)\left\{ \begin{array}{l} {\sigma _{\rm{u}}}/|{u_*}| = 3.54{\left( {1 - 3.28\zeta } \right)^{\frac{1}{3}}}\\ {\sigma _{\rm{v}}}/|{u_*}| = 3.91{\left( {1 - 2.16\zeta } \right)^{\frac{1}{3}}}\\ {\sigma _{\rm{w}}}/|{u_*}| = 0.76{\left( {1 - 13.52\zeta } \right)^{\frac{1}{3}}}\\ {\sigma _{\rm{t}}}/|{t_*}| = 1.32{\left( {0.0005 - \zeta } \right)^{ - \frac{1}{3}}}\\ {\sigma _{\rm{h}}}/|{h_*}| = 1.23{\left( {0.0058 - \zeta } \right)^{ - \frac{1}{3}}}\\ {\sigma _{\rm{c}}}/|{c_*}| = 2.15{\left( {0.0130 - \zeta } \right)^{ - \frac{1}{3}}} \end{array} \right. $ | (7) |

|
图 3 2016年和2017年4 —10月羊卓雍错湖面不稳定大气层结时u(a)、v(b)、w(c)、Ts (d)、dH2O (e)、dCO2 (f)的无量纲标准差随稳定度的变化(五角星代表每个区段的平均值,区段分别取-100~-10~-1~-0.1~-0.01~-0.001~-0.0001~-0.00001) Fig.3 Variations of the dimensionless standard deviations of u (a), v (b), w (c), Ts (d), dH2O (e) and dCO2 (f) with ζ in unstable stratification in Yamzhog Yumco during April-October 2016 and 2017 (The five-pointed stars represent the mean values of dimensionless quantities and ζ in each section of -100—-10—-1—-0.1—-0.01—-0.001—-0.0001—-0.00001) |
垂直风速标准差的相似性优于水平风速已被多数观测证实[22, 25],说明地形起伏及下垫面物理特性差异对垂直湍流的影响较小.地形的作用主要影响水平方向的湍流运动,因为水平方向的脉动主要由“大”的准水平湍流产生,往往“记忆”着上风方向的地形特征[42].此外,在不稳定层结下,标量无量纲标准差会随着静力不稳定度的增大而明显减小(图 3d、e、f).原因是,随不稳定度增加,热力湍流运动加强,空气间热交换加快,导致Ts、dH2O和dCO2脉动量变小;而近地层近似为常通量层,物理要素的特征量(t*、h*、c*)随高度几乎不变,其结果是这些标量的无量纲标准差变小[25].
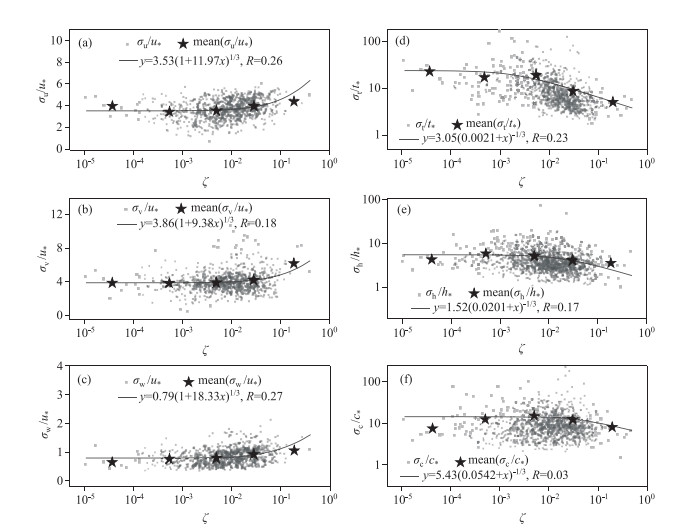
2.2.2 稳定层结稳定层结下,dCO2的无量纲标准差与ζ关系不明显,其余变量(u、v、w、Ts和dH2O)无量纲标准差随稳定度变化基本符合“1/3”或“-1/3”次幂律(公式4)(图 4).各变量最优拟合表达式为:
| $ \left( {\zeta > 0} \right)\left\{ \begin{array}{l} {\sigma _{\rm{u}}}/|{u_*}| = 3.53{\left( {1 + 11.97\zeta } \right)^{\frac{1}{3}}}\\ {\sigma _{\rm{v}}}/|{u_*}| = 3.86{\left( {1 + 9.38\zeta } \right)^{\frac{1}{3}}}\\ {\sigma _{\rm{w}}}/|{u_*}| = 0.79{\left( {1 + 18.33\zeta } \right)^{\frac{1}{3}}}\\ {\sigma _{\rm{t}}}/|{t_*}| = 3.05{\left( {0.0021 + \zeta } \right)^{ - \frac{1}{3}}}\\ {\sigma _{\rm{h}}}/|{h_*}| = 1.52{\left( {0.0201 + \zeta } \right)^{ - \frac{1}{3}}}\\ {\sigma _{\rm{c}}}/|{c_*}| = 5.43{\left( {0.0542 + \zeta } \right)^{ - \frac{1}{3}}} \end{array} \right. $ | (8) |
|
图 4 2016年和2017年4 —10月羊卓雍错湖面稳定大气层结时u(a)、v(b)、w(c)、Ts (d)、dH2O (e)、dCO2 (f)的无量纲标准差随稳定度的变化(五角星代表每个区段的平均值,区段分别取0.00001~0.0001~0.001~0.01~0.1~1~10) Fig.4 Variations of the dimensionless standard deviations of u (a), v (b), w (c), Ts (d), dH2O (e) and dCO2 (f) with ζ in stable stratification in Yamzhog Yumco during April-October 2016 and 2017 (The five-pointed stars represent the mean values of dimensionless quantities and ζ in each section of 0.00001—0.0001—0.001—0.01—0.1—1—10) |
对比图 3和图 4能发现,各变量——尤其标量Ts、dH2O、dCO2,在稳定层结下的标准差数值分布比较离散,且拟合效果也不如不稳定层结的结果. Li等[26]和刘辉志等[27]的研究也揭示不稳定层结下相似性关系较好,而稳定层结下关系消失.其原因可能是稳定度增加到某种程度,大气波动、间歇湍流和蜿蜒运动等导致其偏离相似规律.
2.2.3 近中性层结大气层结接近中性时(|ζ|→0),近地层湍流主要由机械湍流生成,热力作用几乎没有,此时风速分量的无量纲标准差近似等于常数[43].本文将ζ < 0的数据取绝对值,合并ζ > 0的数据后重新拟合,取|ζ|=0得到逼近常数:σu/|u*|=3.57、σv/|u*|=3.93、σw/|u*|=0.77、σt/|t*|=20.91、σh/|h*|=6.35、σc/|c*|=11.96.本文所得大气中性时风速分量无量纲标准差的逼近常数与青藏高原绒布河谷、理塘、玛曲等多地研究结果相近[23, 27, 29].高原地区近中性层结下水平风速标准差普遍大于、垂直风速标准差普遍小于戈壁、平原等地区的拟合值[44-45],可能是由于高原地区常年风速较大所致[23].而拟合系数小于沙漠湖泊和海洋结果[15, 46],可能是受局地环境[15]或观测高度[7]影响,尚待进一步深入研究.
2.3 湍流特征量的统计和变化特征 2.3.1 湍流强度2016和2017年4 —10月u、v和w 3个方向的湍流强度(Iu、Iv和Iw)多数时刻在0.5以内,分别占61.8 %、64.3 %和98.4 %,满足泰勒假说的前提条件,即认为湍涡发展的时间尺度大于其平移过传感器的时间[47].其概率密度分布显示,Iu、Iv和Iw最集中的区间分别是0.2~0.3(20.5 %)、0.2~0.3(22.2 %)和0~0.1(60.3 %);水平方向的湍流强度(Iu和Iv的平均值分别为0.60和0.58)大于垂直方向(Iw的平均值为0.13),数值的离散性也更大(图 5a).

|
图 5 2016年和2017年4 —10月羊卓雍错湖面湍流强度的概率密度函数(a)和随平均风速的变化(b) (b中的点线代表每个区段内湍流强度和风速的平均值,区段长度取风速1 m/s) Fig.5 Probability density functions of three-dimensional turbulent intensities (a) and variations of three-dimensional turbulent intensities with average wind speed (b) in Yamzhog Yumco during April-October 2016 and 2017 (The dot lines in (b) represent the mean values of turbulent intensities and wind speed in each wind speed section with length 1 m/s) |
Iu、Iv和Iw均在U < 1 m/s的微风环境中最强(平均值分别为1.41、1.40和0.31)(图 5b),这是因为在微风环境中大气运动受温度差主导,即浮力作用导致湍流,产生对流运动,边界层大气处于通常所说的自由对流状态,此时湍流发展最为旺盛.随着U增大,Iu、Iv和Iw均明显减弱,但减弱速度逐渐放缓;U > 5 m/s后基本不再随风速变化.根据计算公式(1),I的大小取决于风速分量标准差(σu、σv和σw)和平均风速(U);Iu、Iv和Iw均随U增大而减小(图 5b),并呈显著负相关性(R=-0.39、-0.42、-0.34),充分说明平均风速的变化幅度大于风速方差变化幅度.
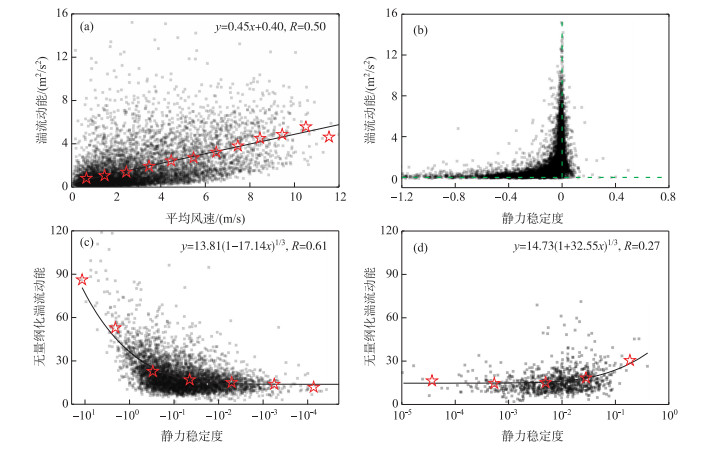
2.3.2 湍流动能大气湍流运动的发生、发展、维持、衰减或消逝,归根到底是取决于湍流动能(TKE)增加、不变或减少的结果[48].根据TKE的公式(2),TKE的大小由3个风速分量的脉动方差决定. U越大,风速分量波动幅度也大,导致TKE越大.张宏升等[49]与李锁锁等[30]的观测均表明TKE随U增大而增大.本文结果显示,湖面大气TKE不仅与U呈正相关,而且二者存在较好的线性关系(图 6a):TKE=0.45U+0.40,R=0.50.
|
图 6 2016年和2017年4 —10月羊卓雍错湖面湍流动能随平均风速(a)、稳定度(b)的变化,以及无量纲化湍流动能随稳定度的变化(c、d) (a中五角星代表每个区段平均值,区段长度取风速1 m/s,c、d中的五角星代表每个区段的平均值,区段分别取-10~-1~-0.1~-0.01~-0.001~-0.0001~-0.00001和0.00001~0.0001~0.001~0.01~0.1~1~10) Fig.6 Variations of turbulent kinetic energy with average wind speed (a), stability (b), and the variations of dimensionless turbulent kinetic energy with stability in unstable stratification (c) and stable stratification (d) in Yamzhog Yumco during April-October 2016 and 2017 (The five-pointed stars in (a) represent the mean values of turbulent kinetic energy and wind speed in each wind speed section with length 1 m/s; The five-pointed stars in (c) and (d) represent the mean values of dimensionless turbulent kinetic energy and stability in the each section of-10—-1—-0.1—-0.01—-0.001—-0.0001—-0.00001 and 0.00001—0.0001—0.001—0.01—0.1—1—10) |
TKE同时受大气层结的影响,大气接近中性时TKE越强,其中TKE > 10 m2/s2的时刻ζ全部位于-0.1~0.1范围内.随大气越稳定或者越不稳定,TKE皆减弱(图 6b),是因为不同层结下为湍流补充动能的驱动力不同.从TKE方程可知,维持涡旋发展的能量主要来自风切变项和浮力项,前者基本比后者大一个数量级,是产生TKE的主要来源[50].大气层结近中性时,唯一或主要的湍流能量产生机制是剪切作用,与之有关的是风剪切和表面应力,浮力作用极小;层结不稳定时,浮力成为驱动湍流的主要机制,即热力驱动是能量的主要来源,而非动力驱动;层结稳定时,因有逆温层,浮力作用不但无法为湍流补给动能,反而起到抑制或削弱作用[20].
随着层结稳定或不稳定程度加剧,无量纲湍流动能(TKE/u*2)的数值及离散性不断增大(图 6c、d),且变化符合“1/3”次幂律(公式(4)),最优拟合式为:
| $ \left\{ \begin{array}{l} TKE/u_*^2 = 13.81{\left( {1 - 17.14\zeta } \right)^{\frac{1}{3}}}\;\;\;\;\;\left( {\zeta < 0} \right)\\ TKE/u_*^2 = 14.73{\left( {1 + 32.55\zeta } \right)^{\frac{1}{3}}}\;\;\;\;\;(\zeta > 0) \end{array} \right. $ | (9) |
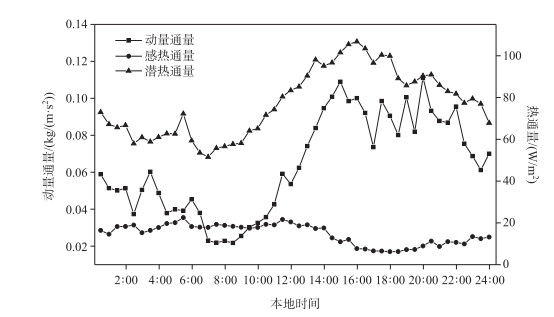
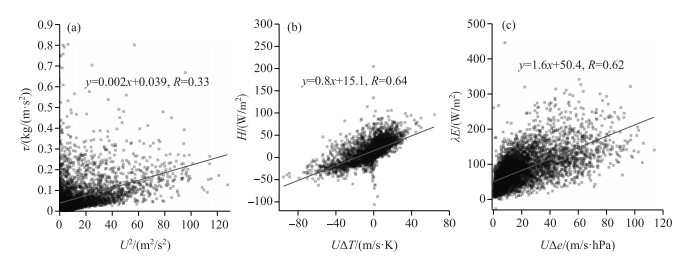
羊卓雍错湖面的动量通量、感热通量和潜热通量均存在明显日变化.动量通量夜间逐渐减弱,8:30达到最低值0.022 kg/(m·s2),然后迅速增强,15:00时达0.109 kg/(m·s2),下午到傍晚保持高值(图 7).动量通量对风速有强烈依赖性[51].观测点下午到傍晚多处于大风环境,使得湖面粗糙度偏大,动力湍流增加,大气向湖面输送动量增强. 4 —10月30 min动量通量与风速和风速平方均有较好的相关性,相关系数分别达0.32和0.33,动量通量与风速平方的拟合回归方程式为:y=0.002x+0.039(图 8a).
|
图 7 2016年和2017年4 —10月羊卓雍错湖面动量通量、感热通量和潜热通量的日变化 Fig.7 Diurnal variations of momentum flux, sensible heat flux and latent heat flux in Yamzhog Yumco during April-October 2016 and 2017 |
|
图 8 2016年和2017年4 —10月羊卓雍错湖面动量通量与风速平方(a)、感热通量与风速和湖—气温差(ΔT)的乘积(b)以及潜热通量与风速和饱和水汽压差(Δe)的乘积(c)的关系 Fig.8 Relationships between momentum flux and the square value of wind speed (a), sensible heat flux and the product of wind speed and difference in temperature (ΔT) between the water surface and overlying air (b), and latent heat flux and the product of wind speed and difference in vapor pressure (Δe) between water-air interface and overlying air (c) in Yamzhog Yumco during April-October 2016 and 2017 |
羊卓雍错湖面热量输送以潜热为主,4 —10月潜热通量日平均值(77.3 W/m2)是感热通量(14.6 W/m2)的5.3倍.感热和潜热通量日变化均表现为单波峰日变化规律,感热通量夜间逐渐增强,5:30达到峰值22.4 W/m2,18:00降到谷值6.1 W/m2;潜热通量在7:00时最低(51.4 W/m2),16:00时最高(106.6 W/m2)(图 7).感热和潜热通量的峰值分别出现在清晨和下午,与Guo等[31]、Liu等[14]研究色林错和洱海所得结果一致.湖面感热通量与湖—气温差、风速与湖—气温差的乘积存在显著正相关(R=0.63、0.64),但与风速的相关性不明显(R=-0.08),这与青海湖[31]和太湖[52]的结论(R分别为0.27和0.36)有所不同.湖面潜热通量与风速、饱和水汽压差以及风速和饱和水汽压差的乘积均存在较好的相关性(R=0.63、0.34、0.62).拟合结果显示,感热通量与风速和湖—气温差乘积的线性方程为y=0.8x+15.1,潜热通量与风速和饱和水汽压差乘积的线性方程为y=1.6x+50.4(图 8b、c).
3 结论通过分析2016和2017年4 —10月表征羊卓雍错湖泊的涡动观测数据,揭示该湖泊湖面风速分量无量纲标准差随稳定度的变化满足Monin-Obukhov相似理论的“1/3”次幂律,拟合效果为w > u > v方向,当大气层结近中性时σu/|u*|=3.57、σv/|u*|=3.93、σw/|u*|=0.77.超声虚温、水汽和CO2密度等标量仅在不稳定层结下服从“-1/3”次幂律,稳定条件下拟合效果较差,尤其CO2密度的无量纲标准差与稳定度无明显关系.羊卓雍错湖面大气的水平湍流强度较垂直方向强(Iu≈Iv > Iw),Iu、Iv和Iw均随平均风速增大而减弱,减弱速度逐渐放缓.湖面湍流动能随风速增大而增大,而且呈显著线性变化关系(增长率达0.45 m/s).湖面动量通量在下午和傍晚输送较强,热通量输送以潜热为主、向上输送,感热和潜热通量的峰值分别出现在清晨和下午.动量通量与风速的平方、感热通量与风速和湖—气温差的乘积以及潜热通量与风速和饱和水汽压差的乘积均存在显著正相关关系.
致谢: 感谢西藏白地水文站米玛次仁、天津师范大学者萌及北京天诺基业科技有限公司杨超、孔维维等先生在野外仪器安装和维护等诸多方面给予的悉心指导与鼎力相助.
| [1] |
Song CQ, Huang B, Ke LH et al. Seasonal and abrupt changes in the water level of closed lakes on the Tibetan Plateau and implications for climate impacts. Journal of Hydrology, 2014, 514: 131-144. DOI:10.1016/j.jhydrol.2014.04.018 |
| [2] |
Xiao W, Liu SD, Li XH et al. Transfer coefficients of momentum, heat and water vapour in the atmospheric surface layer of a large shallow freshwater lake:A case study of Lake Taihu. J Lake Sci, 2012, 24(6): 932-942. [肖薇, 刘寿东, 李旭辉等. 大型浅水湖泊与大气之间的动量和水热交换系数——以太湖为例. 湖泊科学, 2012, 24(6): 932-942. DOI:10.18307/2012.0617] |
| [3] |
Long Z, Perrie W, Gyakum J et al. Northern lake impacts on local seasonal climate. Journal of Hydrometeorology, 2007, 8(4): 881-896. DOI:10.1175/JHM591.1 |
| [4] |
Flagg D, Brook J, Sills D et al. Lake Breezes in Southern Ontario: Observations, models and impacts on air quality. In: Borrego C, Miranda AI eds. Air pollution modeling and its application XIX. NATO Science for Peace and Security Series Series C: Environmental Security. Dordrecht: Springer, 2008: 679-680.
|
| [5] |
Samuelsson P, Kourzeneva E, Mironov D. The impact of lakes on the European climate as simulated by a regional climate model. Boreal Environment Research, 2010, 15(2): 113-129. |
| [6] |
Wang W. Energy budget at Lake Taihu and its response to climate change[Dissertation]. Nanjing: Nanjing University of Information Science and Technology, 2014: 1-3. [王伟.太湖能量收支及其对气候变化的响应[学位论文].南京: 南京信息工程大学, 2014: 1-3. http://cdmd.cnki.com.cn/404.htm ]
|
| [7] |
Xiao W, Liu SD, Wang W et al. Transfer coefficients of momentum, heat and water vapour in the atmospheric surface layer of a large freshwater lake. Boundary-Layer Meteorology, 2013, 148(3): 479-494. DOI:10.1007/s10546-013-9827-9 |
| [8] |
Wang W, Xiao W, Cao C et al. Temporal and spatial variations in radiation and energy balance across a large freshwater lake in China. Journal of Hydrology, 2014, 511: 811-824. DOI:10.1016/j.jhydrol.2014.02.012 |
| [9] |
Lee XH, Liu SD, Xiao W et al. The Taihu Eddy Flux Network:An observational program on energy, water, and greenhouse gas fluxes of a large freshwater lake. Bulletin of the American Meteorological Society, 2014, 95. DOI:10.1175/BAMS-D-13-00136.1 |
| [10] |
Zhao XS, Wang SG, Li M et al. Energy flux measurements and environmental controls in summer over the Poyang Lake, China. J Lake Sci, 2014, 26(6): 955-962. [赵晓松, 王仕刚, 李梅等. 鄱阳湖夏季水热通量特征及环境要素影响分析. 湖泊科学, 2014, 26(6): 955-962. DOI:10.18307/2014.0619] |
| [11] |
Zhao XS, Liu YB. Phase transition of surface energy exchange in China's largest freshwater lake. Agricultural and Forest Meteorology, 2017, 244/245: 98-110. DOI:10.1016/j.agrformet.2017.05.024 |
| [12] |
Wang BB, Ma YM, Chen XL et al. Observation and simulation of lake-air heat and water transfer processes in a high-altitude shallow lake on the Tibetan Plateau. Journal of Geophysical Research:Atmospheres, 2015, 120(24): 12327-12344. DOI:10.1002/2015JD023863 |
| [13] |
Wang BB, Ma YM, Ma WQ et al. Physical controls on half-hourly, daily, and monthly turbulent flux and energy budget over a high-altitude small lake on the Tibetan Plateau. Journal of Geophysical Research:Atmospheres, 2017, 122(4): 2289-2303. DOI:10.1002/jgrd.v122.4 |
| [14] |
Liu HZ, Feng JW, Sun JH et al. Eddy covariance measurements of water vapor and CO2, fluxes above the Erhai Lake. Science China:Earth Sciences, 2015, 58(3): 317-328. DOI:10.1007/s11430-014-4828-1 |
| [15] |
Hu WF, Wang NA, Zhao LQ et al. Water-heat exchange over a typical lake in Badain Jaran Desert, China. Progress in Geography, 2015, 34(8): 1061-1071. [胡文峰, 王乃昂, 赵力强等. 巴丹吉林沙漠典型湖泊湖气界面水-热交换特征. 地理科学进展, 2015, 34(8): 1061-1071.] |
| [16] |
Nordbo A, Launiainen S, Mammarella I et al. Long-term energy flux measurements and energy balance over a small boreal lake using eddy covariance technique. Journal of Geophysical Research:Atmospheres, 2011, 116(D2). DOI:10.1029/2010JD014542 |
| [17] |
Wang DD, Wang W, Liu SD et al. Characteristics of modeling hourly water surface evaporation in Lake Taihu and comparison of simulation results by three models. J Lake Sci, 2017, 29(6): 1538-1550. [王丹丹, 王伟, 刘寿东等. 太湖小时尺度水面蒸发特征及3种模型模拟效果对比. 湖泊科学, 2017, 29(6): 1538-1550. DOI:10.18307/2017.0626] |
| [18] |
Assouline S, Tyler SW, Tanny J et al. Evaporation from three water bodies of different sizes and climates:Measurements and scaling analysis. Advances in Water Resources, 2008, 31(1): 160-172. DOI:10.1016/j.advwatres.2007.07.003 |
| [19] |
Hu YQ. Boundary layer meteorology. Advance in Earth Sciences, 1991, 6(6): 57-59. [胡隐樵. 边界层气象学. 地球科学进展, 1991, 6(6): 57-59.] |
| [20] |
Sheng PX, Mao JT, Li JG et al. Atmospheric Physics. Beijing: Peking University Press, 2003: 239-272. [盛裴轩, 毛节泰, 李建国等. 大气物理学. 北京: 北京大学出版社, 2003: 239-272.]
|
| [21] |
Monin AS, Obukhov AM. Dimensionless characteristics of turbulence in the atmospheric surface layer. Doklady Akademii Nauk SSSR, 1953, 93(2): 223-226. |
| [22] |
Liu HZ, Hong ZX. Turbulent characteristics in the surface layer over Gerze Area in the Tibetan Plateau. Scientia Atmospherica Sinica, 2000, 24(3): 289-300. [刘辉志, 洪钟祥. 青藏高原改则地区近地层湍流特征. 大气科学, 2000, 24(3): 289-300. DOI:10.3878/j.issn.1006-9895.2000.03.01] |
| [23] |
Chen YG, Zhang Y, Wang SY et al. Seasonal variation of turbulence characteristics over alpine meadow ecosystem. Plateau Meteorology, 2014, 33(3): 585-595. [陈云刚, 张宇, 王少影等. 高寒草甸湍流特征量的季节变化特征. 高原气象, 2014, 33(3): 585-595.] |
| [24] |
Yang LW, Gao XQ, Hui XY et al. Study on turbulence characteristics in the atmospheric surface layer over Nyainrong grassland in central Qinghai-Tibetan Plateau. Plateau Meteorology, 2017, 36(4): 875-885. [杨丽薇, 高晓清, 惠小英等. 青藏高原中部聂荣亚寒带半干旱草地近地层湍流特征研究. 高原气象, 2017, 36(4): 875-885.] |
| [25] |
Ma YM, Ma WQ, Hu ZY et al. Similarity analysis of atmospheric turbulent intensity over grassland surface of Qinghai-Xizang Plateau. Plateau Meteorology, 2002, 21(5): 514-517. [马耀明, 马伟强, 胡泽勇等. 青藏高原草甸下垫面湍流强度相似性关系分析. 高原气象, 2002, 21(5): 514-517. DOI:10.3321/j.issn:1000-0534.2002.05.012] |
| [26] |
Li MS, Ma YM, Ma WQ et al. Analysis of turbulence characteristics over the northern Tibetan Plateau area. Advances in Atmospheric Sciences, 2006, 23(4): 579-585. DOI:10.1007/s00376-006-0579-z |
| [27] |
Liu HZ, Feng JW, Zou H et al. Turbulent characteristics of the surface layer in Rongbuk Valley on the northern slope of Mt. Qomolangma. Plateau Meteorology, 2007, 26(6): 1151-1161. [刘辉志, 冯健武, 邹捍等. 青藏高原珠峰绒布河谷地区近地层湍流输送特征. 高原气象, 2007, 26(6): 1151-1161.] |
| [28] |
Guo XF, Zhang HS, Cai XH et al. Flux-variance method for latent heat and carbon dioxide fluxes in unstable conditions. Boundary-Layer Meteorology, 2009, 131(3): 363-384. DOI:10.1007/s10546-009-9377-3 |
| [29] |
Li Y, Li YQ, Zhao XB. Analysis of turbulent characteristics in the surface layer inLitang region on the east edge of Tibetan Plateau. Plateau Meteorology, 2009, 28(4): 745-753. [李英, 李跃清, 赵兴炳. 青藏高原东坡理塘地区近地层湍流特征研究. 高原气象, 2009, 28(4): 745-753.] |
| [30] |
Li SS, Lv SH, Gao YH et al. Analysis of the statistical characteristics of the turbulent data at Maqu area in the upper Yellow River. Advances in Earth Science, 2012, 27(8): 901-907. [李锁锁, 吕世华, 高艳红等. 黄河上游玛曲草原湍流统计特征分析. 地球科学进展, 2012, 27(8): 901-907.] |
| [31] |
Guo YH, Zhang YS, Ma N et al. Quantifying surface energy fluxes and evaporation over a significant expanding endorheic lake in the central Tibetan Plateau. Journal of the Meteorological Society of Japan, 2016, 94(5): 453-465. DOI:10.2151/jmsj.2016-023 |
| [32] |
Li XY, Ma YJ, Huang YM et al. Evaporation and surface energy budget over the largest high-altitude saline lake on the Qinghai-Tibet Plateau. Journal of Geophysical Research:Atmospheres, 2016, 121(18): 10470-10485. DOI:10.1002/jgrd.v121.18 |
| [33] |
Li ZG, Lyu SH, Ao YH et al. Long-term energy flux and radiation balance observations over Lake Ngoring, Tibetan Plateau. Atmospheric Research, 2015, 155: 13-25. DOI:10.1016/j.atmosres.2014.11.019 |
| [34] |
Chu D, Pu Q, Laba ZM et al. Remote sensing analysis on lake area variations of Yamzho Yunco in Tibetan Plateau. J Lake Sci, 2012, 24(3): 494-502. [除多, 普穷, 拉巴卓玛等. 近40 a西藏羊卓雍错湖泊面积变化遥感分析. 湖泊科学, 2012, 24(3): 494-502. DOI:10.18307/2012.0324] |
| [35] |
LI-CORInc ed. EddyPro software instruction manual: 13th edition, 2017. https://www.licor.com/env/support/product?p=ec.
|
| [36] |
Lee XH, Massman W, Law B. Handbook of micrometeorology:A guide for surface flux measurement and analysis. Dordrecht: Kluwer Academic Publishers, 2004: 181-208.
|
| [37] |
Schmid HP, Csb G, Cropley F et al. Measurements of CO2 and energy fluxes over a mixed hardwood forest in the mid-western United States. Agricultural and Forest Meteorology, 2000, 103(4): 357-374. DOI:10.1016/S0168-1923(00)00140-4 |
| [38] |
Kljun N, Calanca P, Rotach MW et al. A simple parameterization for flux footprint predictions. Boundary-Layer Meteorology, 2004, 112(3): 503-523. DOI:10.1023/B:BOUN.0000030653.71031.96 |
| [39] |
Stull RB ed. Trans. by Yang CX. An introduction to boundary layer meteorology. Beijing: Meteorological Press, 1991: 48-50, 187-191. [Stull RB著.杨长新译.边界层气象学导论.北京: 气象出版社, 1991: 48-50, 187-191. ]
|
| [40] |
Panofsky HA, Tennekes H, Lenschow DH et al. The characteristics of turbulent velocity components in the surface layer under convective conditions. Boundary-Layer Meteor, 1977, 11(3): 355-361. DOI:10.1007/BF02186086 |
| [41] |
Tillman JE. The indirect determination of stability, heat and momentum fluxes in the atmospheric boundary layer from simple scalar variables during dry unstable conditions. Journal of Applied Meteorology, 1972, 11(5): 783-792. DOI:10.1175/1520-0450(1972)011<0783:TIDOSH>2.0.CO;2 |
| [42] |
Zhao M, Miao MQ, Wang YC. Boundary meteorology. Beijing: Meteorology Press, 1991: 465. [赵鸣, 苗曼倩, 王彦昌. 边界层气象学教程. 北京: 气象出版社, 1991: 465.]
|
| [43] |
Yue P, Zhang Q, Niu SJ et al. Statistical characteristic of atmospheric turbulence in clear and dust weather conditions in Inner Mongolian Grassland during spring. Plateau Meteorology, 2011, 30(5): 1180-1188. [岳平, 张强, 牛生杰等. 春季内蒙古草原典型晴天与沙尘条件下湍流速度统计特征对比分析. 高原气象, 2011, 30(5): 1180-1188.] |
| [44] |
Panofsky HA, Dutton JA. Atmospheric turbulence. Models and methods for engineering applications. New York: John Wiley & Sons Inc.
|
| [45] |
Zhang HS, Li FY, Chen JY. Statistical characteristics of atmospheric turbulence in different underlying surface conditions. Plateau Meteorology, 2004, 23(5): 598-604. [张宏升, 李富余, 陈家宜. 不同下垫面湍流统计特征研究. 高原气象, 2004, 23(5): 598-604. DOI:10.3321/j.issn:1000-0534.2004.05.004] |
| [46] |
Duan ZQ. Eddy covariance measurements of marine atmospheric boundary-layer turbulence and air-sea fluxes. Qingdao: Ocean University of China[Dissertation], 2013: 36-59. [段自强.利用涡动相关法研究海洋大气边界层湍流特征与海气物质交换[学位论文].青岛: 中国海洋大学, 2013: 36-59. http://cdmd.cnki.com.cn/Article/CDMD-10423-1013348181.htm ]
|
| [47] |
Willis GE, Deardorff JW. On the use of Taylor's translation hypothesis for diffusion in the mixed layer. Quarterly Journal of the Royal Meteorological Society, 1976, 102(434): 817-822. http://onlinelibrary.wiley.com/doi/10.1002/qj.49710243411/full
|
| [48] |
Yu ZH, Miao MQ, Jiang QR et al. Fluid mechanics:3rd edition. Beijing: Meteorology Press, 2004: 212-218. [余志豪, 苗曼倩, 蒋全荣等. 流体力学:第三版. 北京: 气象出版社, 2004: 212-218.]
|
| [49] |
Zhang HS, Liu XJ, Zhu H et al. Characteristics of turbulent transfer during the strong wind period in the northern suburbs of Beijing. Chinese Journal of Atmospheric Sciences, 2010, 34(3): 661-668. [张宏升, 刘新建, 朱好等. 北京北郊冬季大风过程湍流通量演变特征的分析研究. 大气科学, 2010, 34(3): 661-668. DOI:10.3878/j.issn.1006-9895.2010.03.17] |
| [50] |
Wang YJ, Xu XD, Zhao TL et al. Structures of convection and turbulent kinetic energy in boundary layer over the southeastern edge of the Tibetan Plateau. Science China:Earth Sciences, 2015, 58(7): 1198-1209. DOI:10.1007/s11430-015-5054-1 |
| [51] |
Ma YM, Wang JM, Zhang QR et al. The analysis of turbulent fluxes transfer characteristics over Nansha region. Plateau Meteorology, 1997, 16(1): 45-51. [马耀明, 王介民, 张庆荣等. 南沙海域大气湍流通量输送特征分析. 高原气象, 1997, 16(1): 45-51. DOI:10.3321/j.issn:1000-0534.1997.01.007] |
| [52] |
Huang R, Zhao JY, Xiao W et al. Temporal variability of radiation and energy budgets over Lake Taihu. Resources and Environment in the Yangtze Basin, 2016, 25(5): 733-742. [黄锐, 赵佳玉, 肖薇等. 太湖辐射和能量收支的时间变化特征. 长江流域资源与环境, 2016, 25(5): 733-742. DOI:10.11870/cjlyzyyhj201605006] |
 2019, Vol. 31

