天然胶体(natural colloids, NCs)通常是指一维粒径介于1 nm~1 μm之间的物质[1]. NCs广泛存在于水环境中,由于其颗粒小、比表面积大、活性基团丰富,因此NCs能够在环境中长距离迁移,并深刻影响着环境中重金属、药物等污染物的赋存分配、迁移转化等环境行为[2-4].湖泊水体中的NCs主要为外源或内源输入,其主导因素分别为人类活动以及湖泊水体中微生物活动、水动力条件等[5].相较于天然湖泊,城市内湖一般水深较浅,因此NCs受水体扰动影响更大,湖泊底泥再悬浮作用、湖水自身高生产力等使得城市内湖水体中NCs丰度更高[6-7].加之城市内湖水体通常污染较重,受人为影响较大[8-9].因此,研究城市内湖水中NCs对了解湖水环境中污染物的迁移转化意义重大.
受气候、水动力条件、外源输入等的影响,不同湖泊中的NCs化学组成差异较大[10-11].并且,NCs物质组成的差异会进一步影响其在湖泊水环境中的持久性.如有研究发现,随着水流滞留时间的增加,外源性NCs降解较快,但内源NCs却能够长期存在[10-11].但亦有研究报道,在湖泊中,由于内源NCs比外源NCs的C/N比高、碳水化合物更多,从而更容易被降解并参与到微食物网中[12-13].湖泊水体中的NCs主要通过微生物降解、光化学降解以及絮凝沉淀作用发生转化[14-16].由于光化学降解主要发生在水质较好的水体或典型有色溶解性有机质中[17-18],因此在水质相对较差的城市内湖中微生物降解则是NCs在湖水中转化的重要途径.目前国内相关研究主要关注太湖等富营养湖泊中微生物对NCs降解的影响[13, 19].这类湖泊中藻类、水生植物生长旺盛,水中NCs的类蛋白比例较高,其NCs降解过程必然不同于类腐殖质比例较高的城市内湖水中NCs.然而,目前有关城市内湖水体中微生物对NCs物质组成降解特性影响的研究还较少,尤其是有关不同粒径NCs荧光特性的研究更待开展.除微生物降解过程,自团聚过程导致的絮凝沉淀是湖泊NCs转化的另一重要途径之一,该过程对碳循环、养分动态变化等起到重要作用,近年来引起广泛关注[20-21].但已有研究较少关注该过程对NCs理化特性(如粒径、组成及不同粒级分配关系等)的影响,并且在研究过程中常常与微生物降解过程分开考虑,这显然与事实不符[22].因此,综合考虑微生物降解(生物降解)和自团聚过程(非生物降解)对湖泊水体中NCs理化性质(如不同粒径NCs荧光特性)的影响,对于深入了解水环境中NCs迁移转化等环境行为具有重要意义.
瑶湖是南昌市区内最大的封闭型浅水湖,受水产/畜禽养殖、城镇化过程等人为活动影响,水体污染严重[23-24]. NCs是环境中污染物的重要载体,对瑶湖水中NCs环境行为的研究有助于深入了解瑶湖水污染问题.然而,目前有关瑶湖水质的研究主要集中于氮、磷等常规污染物的检测[25],而针对水中NCs的迁移转化及其影响下的污染物环境行为等相关研究严重不足.基于此,本文选取瑶湖水体及注入瑶湖的一条黑臭河流水体为研究对象,利用切向超滤技术及三维荧光光谱法(3D-EEM),并结合平行因子分析法,对比不同粒径NCs荧光物质在灭菌和有微生物存在下各自的黑暗降解情况,以探究微生物降解和自团聚过程对湖泊水体中不同粒径NCs荧光物质降解的影响,从而为湖泊水环境中NCs迁移转化及其对污染物环境行为的影响研究提供数据支持.
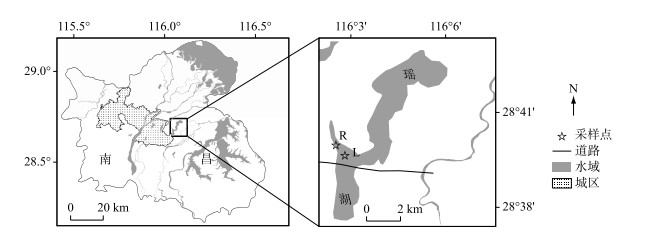
1 材料与方法 1.1 水样的采集与处理于2018年3月采集江西省南昌市最大的淡水湖泊——瑶湖水体(L)及注入瑶湖的一条黑臭河流水体(R),采样点分布见图 1.水样采自表层30 cm内水体,采样的同时测定了水体中温度、溶解氧等基本理化参数(表 1).水样运回实验室后立即用经过400℃煅烧后的1 μm和0.45 μm玻璃纤维滤膜(PAUL, 美国)先后过滤分别得到含1 μm和0.45 μm粒径NCs的水样.接着将含0.45 μm粒径NCs的水样利用切向超滤技术得到真溶解态水样(< 1 kDa) (内置1 kDa超滤膜,聚醚砜滤膜,5×10-3 m2,Vivaflow 50,赛多利斯,德国).具体超滤方法参照作者前期研究[3],超滤倍数(cf)为10.因此,通过上述过滤、超滤处理,得到L和R含4种粒径NCs的水样,分别记为W原水、W1 μm、W0.45 μm和W1 kDa.
|
图 1 瑶湖水体样品采集位置分布 Fig.1 The distribution of sampling sites of waters from Lake Yaohu |
| 表 1 水样理化参数 Tab. 1 Physicochemical properties of the water samples |
所有样品的培育过程均于暗室中进行以去除光降解对实验的影响.首先,将L和R水样含4种粒径NCs的水体(即W原水、W1 μm、W0.45 μm和W1 kDa,各100 mL)分为2组,Ⅰ组为加入0.2 g/L NaN3的灭菌组,Ⅱ组为未做灭菌处理的对照组,实验设置2组平行样.灭菌组反映的是自团聚过程对体系中荧光特性的影响,而对照组反映的是微生物降解及自团聚过程共同作用对体系中荧光特性的影响.待获得含所有粒径NCs的水样后,立即测定其3D-EEMs(初始值).接着加入NaN3,并开始计时,分别于第3、8、15、30天取样测定3D-EEMs.除了测定3D-EEMs图谱外,同时还测定每一时间间隔对照组中W1 μm及W1 kDa水样的细菌丰度及溶解性有机碳(DOC)浓度[3, 26].
1.3 三维荧光光谱测定所有水样的三维荧光光谱(3D-EEMs)数据使用FLS 980荧光光谱检测器测定,仪器配备了450 W氙灯(爱丁堡, 英国).激发(Ex)和发射(Em)波长范围分别为200~450、250~600 nm,增量均为5 nm.狭缝宽度为4 nm,滞留时间为0.1 s.考虑到内滤波效应,利用Milli-Q超纯水对R水样及部分L水样进行了不同浓度稀释,稀释倍数依据水样在254 nm处的吸光度是否小于0.3而定[27].
1.4 数据处理 1.4.1 平行因子分析(PARAFAC)在进行PARAFAC处理前,对所有3D-EEMs数据利用Matlab 2012a进行瑞利和拉曼散射校正[28].同时利用Milli-Q超纯水在Ex=350 nm下的拉曼峰进行水拉曼单位校正(r.u.)[29]. PARAFAC模型通过Matlab 2012a软件及DOMFluor工具箱对选取的80个(2种水样×4种粒径×5个时间段×2个平行样)3D-EEMs数据进行分析[30].分析的可靠性通过对半分析及残差、载荷分析得以保证,模型逐步从3个组分数递增到6个组分进行检验,结果表明4组分数能较好地通过对半检验、残差及载荷分析.模型输出的最大荧光强度(Fmax)值即为各样品对应的各荧光组分强度[31].对输出的PARAFAC组分通过在线OpenFluor数据库平台进行物质判定(http://www.openfluor.org)[32].
通过上一分级粒径水样的荧光强度扣除下一级粒径水样的荧光强度得到相应粒径NCs中荧光组分的荧光强度,以0.45~1 μm粒径NCs为例(公式(1)):
| $ {\rm{ Intensity }}(0.45 \sim 1\;{\rm{ \mathsf{ μ} m}}) = {\rm{ Intensity }}( < 1\;{\rm{ \mathsf{ μ} m}}) - {\rm{ Intensity }}( < 0.45\;{\rm{ \mathsf{ μ} m}}) $ | (1) |
以Fn(280)及Fn(355)作为水样中类蛋白及类腐殖质的浓度[33].具体计算方法如下:Fn(280)为Ex=280 nm、Em=340~360 nm时的最大荧光强度值;Fn(355)为Ex=355 nm、Em=440~470 nm时的最大荧光强度值.以上所有荧光强度均为散射校正、超纯水空白校正后的结果.
腐殖化指数(humification index, HIX)最早用于评价土壤中溶解性有机质的成熟度时引入[34]. HIX定义为Em=254 nm、Ex为300~345 nm和435~480 nm波长下峰面积的比值,可表示有机质组分的腐殖化程度随降解过程的变化情况.
1.4.3 降解动力学水样中荧光物质的降解率(R, %)的计算方法为:
| $ R = C/{C_0} \times 100\% $ | (2) |
式中, C和C0分别为荧光组分的荧光强度在某一降解时刻值及初始值.
含不同粒径NCs水样的PARAFAC组分及荧光指数随时间的降解可采用准一级反应动力学进行模拟,公式为:
| $ \ln\left( {C/{C_0}} \right) = - k \cdot t $ | (3) |
式中, k为降解速率(d-1), t为降解时间(d).
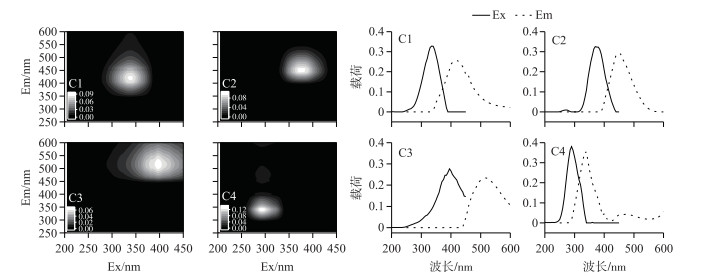
2 结果与讨论 2.1 PARAFAC组分特征分析通过PARAFAC模型,共解析出4个荧光组分. PARAFAC组分的3D-EEM图谱及最大Ex、Em波长、物质组成及信息描述等见图 2及表 2. C1(335/420 nm)和C4(290/340 nm)在OpenFluor数据库中的匹配度较高,说明C1和C4为环境中常见荧光物质.其中C1为可见富里酸[35],与表层沉积物及悬浮颗粒物中水溶性有机质的人为源类腐殖物质相似[36];C4组分与河流沉积物来源的类蛋白物质相似[37],为典型海洋中微生物源类蛋白物质[38-39].由检验模型匹配度的收敛系数(TCC, Tucker Convergence Coefficient)可知,数据库中可与C2(370/455 nm)和C3(395/515 nm)匹配的模型数较少(TCC值较小),其中C2为土壤富里酸[40-41],C3为类腐殖质[42].
|
图 2 PARAFAC组分3D-EEM图及其最大Ex/Em位置 Fig.2 3D-EEM and the maximum excitation/emission wavelength positions of PARAFAC components |
| 表 2 OpenFluor数据库中PARAFAC组分的最大TCC值* Tab. 2 The max value of TCC for the PARAFAC components between the present study and the OpenFluor database |
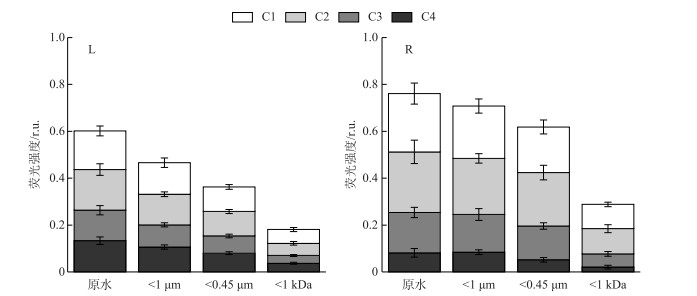
瑶湖水体(L)及其支流水体(R)初始时刻含不同粒径NCs水样的荧光强度分布见图 3.两种水样的荧光强度均随粒径减小而减小,这说明所有粒径分级水样中均含有荧光物质.所有粒径分级水样均以类腐殖物质为主(C1~C3),类蛋白物质较少(C4),尤其是R水样尤为明显.对于L水样,含不同粒径NCs水体的C1~C4组分荧光强度相差不大,但随粒径减小各组分荧光强度减小的情况不同. W原水→W1 μm、W1 μm→W0.45 μm各组分荧光强度变幅相差不大(均值0.03 r.u.),但W0.45 μm→W1 kDa各组分荧光强度的变幅较大(均值0.045 r.u.). R水样中,总荧光强度明显高于L水样,说明支流水体中荧光物质较多,可能是瑶湖水体荧光物质的来源之一.但所有粒径分级水样C1~C4组分荧光强度的变化规律与L水样一致,即W原水→W1 μm、W1 μm→W0.45 μm各组分荧光强度变幅较小(0.01~0.02 r.u.),W0.45 μm→W1 kDa水样则高达0.08 r.u..以上结果说明大部分的荧光物质主要分布在1 kDa~0.45 μm粒径范围内,而这一粒径范围正是典型胶体物质部分,这与前人研究结果一致[43].
|
图 3 初始时刻瑶湖水体(L)和支流水体(R)含不同粒径NCs水样荧光组分的分布 Fig.3 Distribution of fluorescence intensity in water samples with different sizes of NCs from Lake Yaohu(L) and its tributaries(R) samples at the initial moment |
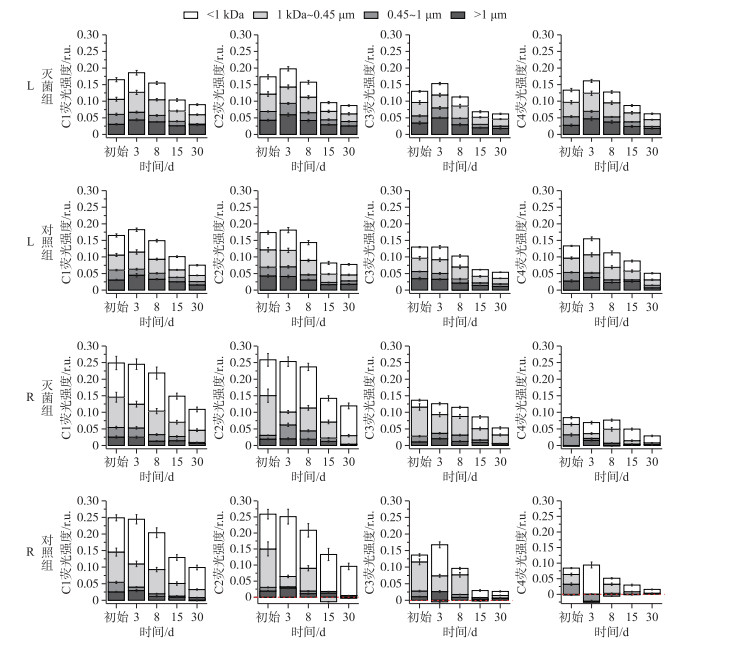
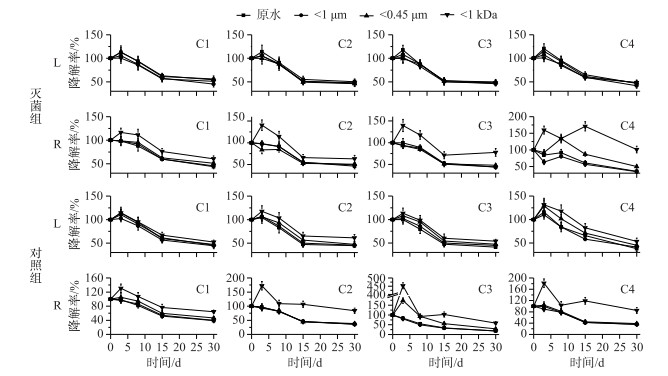
L及R水样不同粒径NCs中C1~C4组分随时间的变化如图 4所示.对于L水样,无论有无微生物存在,在培育的第3天各荧光组分总荧光强度均出现小幅上升,随后开始明显下降(第3~15天),但培育15天后荧光强度下降速率减慢.对于R水样,除未出现在培育第3天荧光强度小幅上升的情况,其他变化规律与L水样一致.总体来说,R水样对照组(有微生物)中荧光组分的减少比灭菌组多.
|
图 4 含不同粒径NCs瑶湖水体(L)和支流水体(R)在微生物存在及灭菌条件下C1~C4组分的降解情况 (图中红色虚线下方表示相应组分荧光强度的增加) Fig.4 Degradation of fluorescence component in water samples with different size of NCs from Lake Yaohu(L) and its tributaries(R) samples with and without microorganisms |
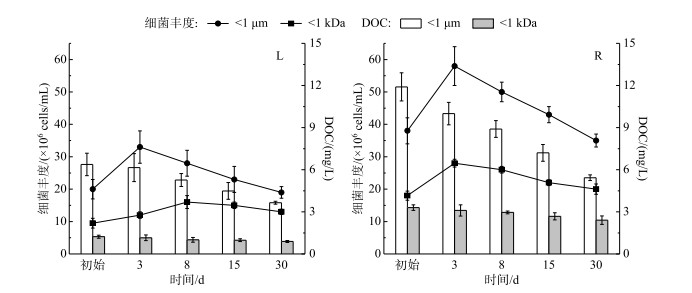
微生物降解对不同粒径NCs中荧光物质变化的影响在L水样不明显,但在R水样影响较大(除C1组分外). C1~C4组分在不同粒径NCs中的减少以小粒径NCs(< 1 kDa和1 kDa~0.45 μm)较多、大粒径NCs较少(0.45~1 μm和>1 μm),在R水样中甚至出现中、小粒径(1 kDa~0.45 μm或0.45~1 μm) NCs荧光强度增加的情况(R水样对照组C2、C3、C4组分).该现象在胶体尺度的相关研究中亦有发现,即颗粒态(>0.45 μm、10 kDa~0.45 μm、1~10 kDa)荧光物质的荧光强度随时间不仅没有减少,反而呈增加趋势,而真溶解态(< 1 kDa)中荧光强度明显减少,该研究认为这可能是因为微生物影响下真溶解态水样中的荧光物质转移至胶体甚至是微米级颗粒中所致[44].该现象同时说明支流水体中微生物对不同粒径NCs荧光物质的微生物降解作用比湖泊水体显著,这可能与支流水体较高的细胞丰度有关(图 5),同时也说明了支流水体微生物可能是湖泊水体微生物的重要来源,但相关结果有待进一步验证.
|
图 5 瑶湖水体(L)和支流水体(R)对照组中W1 μm及W1 kDa细胞丰度及DOC浓度的变化过程 Fig.5 Changes of the bacterial abundance and dissolved organic carbon concentration in < 1 μm and < 1 kDa water sample from Lake Yaohu(L) and its tributaries(R) samples with microorganisms |
L和R水样灭菌组和对照组在不同培育时间下的C1~C4组分荧光强度C与初始值C0的比值(降解率)随时间变化趋势如图 6所示.总体来说,L水样的荧光物质在实验过程中共减少了50 %左右(灭菌组与对照组差别不大),而R水样的荧光物质在灭菌组与对照组中分别减少了50 %和70 %.这说明L水样中自团聚作用是导致其荧光物质减少的主要原因,而R水样中荧光物质的减少则是自团聚作用及微生物降解共同作用的结果(自团聚作用占50 %,微生物降解占20 %).此外,类腐殖质的降解率(即C1、C2和C3组分降解率的平均值)与总体降解率(C1~C4所有组分降解率的平均值)相近并略低于总体降解率,这说明L和R水样中荧光物质的减少主要表现为类腐殖物质的减少.而类蛋白质的降解率在灭菌组中与类腐殖质的降解率相差不大,但在对照组中则明显高于类腐殖质的降解率,且随粒径减小二者的降解率差值逐渐减小,即W原水为20 %、W1 μm为15 % ~18 %、W0.45 μm为10 %、W1 kDa则小于5 %.这说明类蛋白物质主要分布在大粒径水体中,且主要受微生物降解的影响.
|
图 6 瑶湖水体(L)和支流水体(R)含不同粒径NCs水样荧光组分在微生物存在及灭菌条件下的降解率 Fig.6 Degradation rates of fluorescence components in water samples with different size of NCs from Lake Yaohu(L) and its tributaries(R) samples with and without microorganisms |
L水样中所有粒径荧光组分在培育第3天时均出现了一个明显的小幅上升(该结果与前文分析一致,图 4).这可能与降解初期大粒径(W1 μm)水体及小粒径(W1 kDa)水体中的细胞数均显著增加有关,约为初始值的1.5倍(图 5折线图),这与文献报道结果一致[44].含不同粒径NCs水样中各组分在灭菌组中的降解差别不大,说明自团聚过程在所有粒径水样中均存在,且差别不大.但对照组中各荧光组分的变化较明显,其中以W1 kDa降解较缓慢、W0.45 μm次之,这与对照组中W1 kDa的DOC浓度降解较慢的趋势一致(图 5柱状图).结合灭菌组结果可知,大粒径水体中除了有自团聚过程导致的荧光组分减少外,还有微生物降解的作用,而小粒径水体中有机碳及其荧光物质的减少则主要为自团聚作用占主导.
进一步分析发现,大部分荧光物质的降解符合准一级动力学模型(除R水样W1 kDa的C2、C3、C4组分外)(表 3),且拟合R2值有随水样粒径减小而减小的趋势.总体来说,含相同粒径NCs的水样、同一荧光物质的降解以对照组中的速率更快,但W1 kDa差异相对较小.由于细菌、病毒等微生物的粒径基本上大于1 kDa[1],因此W1 kDa可认为是不含微生物的“灭菌”水体.由此可知,大粒径水体中荧光物质的减少受微生物降解的影响比小粒径大,而小粒径水体中荧光物质的降解主要是自团聚作用占主导,这与前文分析结果一致.从细节来看,L水样灭菌组随着粒径减小,其荧光组分的降解速率(k)呈微小波动变化;对照组中则是随粒径减小k值随之减小(表 3),这是因为微生物降解作用随粒径减小而减小.并且,灭菌组和对照组中均以C4组分的k值最高,尤其是对照组更显著,这说明C4组分代表的类蛋白组分降解更快.对于R水样由于W1 kDa中除C1组分外,均不符合准一级动力学模型(R2 < 0.5),因此未给出相应k值.但根据已有数据可知其变化规律与L水样一致,即随水体粒径减小荧光物质的降解速率逐渐降低.与L水样类似,R水样在对照组中C4组分的降解速率较高,说明微生物对类蛋白物质的降解较快.这与上文C4组分荧光强度的减小比例分析结果一致,与胶体尺度范围内类蛋白质、碳水化合物等大分子物质主要是微生物降解占主导、类腐殖质等小分子物质主要是自团聚作用占主导的结论亦一致,研究表明这一现象与其分子量及碳组成有关[44].
| 表 3 瑶湖水体(L)和支流水体(R)含不同粒径NCs水样在微生物存在及灭菌条件下各参数降解速率k值及R2值 Tab. 3 k and R2 values from the pseudo-first-order degradation model of the fluorescence parameters in water samples with different sizes of NCs from Lake Yaohu(L) and its tributaries(R) samples with and without microorganisms |
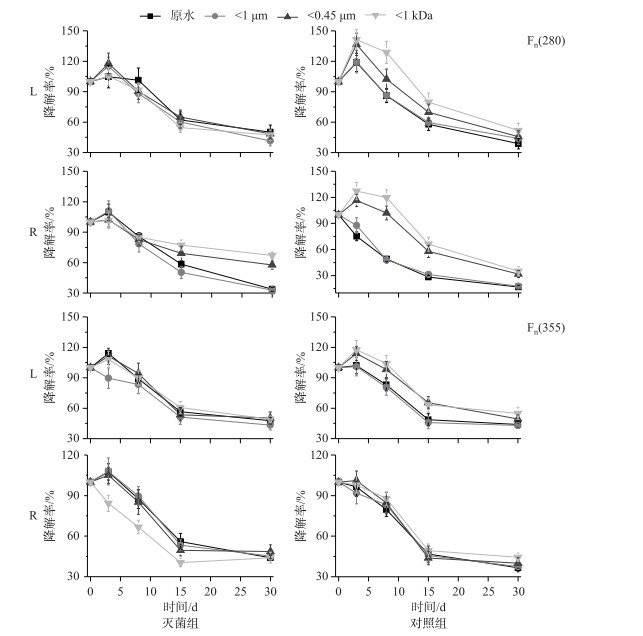
L和R含不同粒径NCs的水样中类蛋白质及类腐殖质浓度随时间的变化如图 7所示.可以看出,对照组中类蛋白物质浓度的减少更为迅速,这一结果与上文荧光组分的分析结果一致.在微生物作用下,大粒径(W原水、W1 μm)水体中类蛋白物质迅速降解,而中、小粒径(W0.45 μm、W1 kDa)水体中的类蛋白物质在降解初期反而有明显增加,这说明在微生物作用下大粒径水体中的类蛋白物质发生降解,并发生了类蛋白物质由大粒径NCs向小粒径NCs转移的现象[44].从k值上看(表 3),L水样含不同粒径NCs的水体在对照组中的k值只是稍大于灭菌组,但R水样则差异较大(约为灭菌组的1.5~3倍),这说明R水样中类蛋白物质比L水样更易被微生物降解.相较于类蛋白物质,两种水样的类腐殖物质在灭菌组和对照组中的降解差异并不明显,这说明微生物对类腐殖物质的降解主要以自团聚作用为主.并且相关学者利用场流分析技术发现,在自团聚作用下类腐殖质还会发生由小粒径向大粒径NCs的转移[44].但在本文中类腐殖质在不同粒径NCs中的差异并不明显,因此还需利用其他手段进一步分析.
|
图 7 瑶湖水体(L)和支流水体(R)含不同粒径NCs水样中Fn(280)和Fn (355)在微生物存在及灭菌条件下的降解率 Fig.7 Degradation rates of Fn (280) and Fn (355) in water samples with different sizes of NCs from Lake Yaohu(L) and its tributaries(R) samples with and without microorganisms |
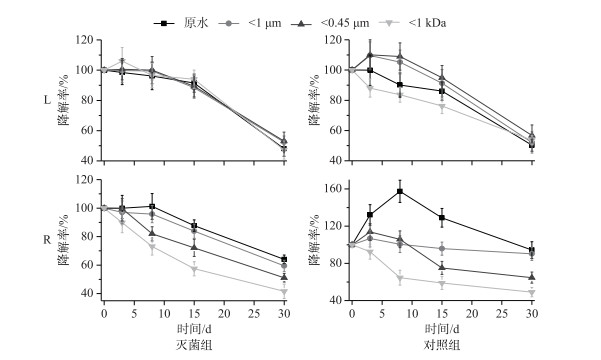
随培育过程的进行,L和R水样含不同粒径NCs水体的腐殖化程度总体来说呈下降趋势(图 8).并且相较于灭菌组,对照组的腐殖化程度变化较大,即中、大粒径(W原水、W1 μm、W0.45 μm)水体的腐殖化程度随时间呈先增加后减小的趋势,而小粒径(W1 kDa)水体的腐殖化程度随时间始终呈减小趋势.这可能是因为在降解初期由于微生物量的增加,增加了将脂肪碳转化为芳香结构的能力,进而使得腐殖化程度增加[45-46].两种水样含不同粒径NCs水体HIX值随时间的变化过程均符合准一级动力学模型(除R水样对照组W原水外)(表 3).对于L水样,HIX值的降解速率k值在含各粒径NCs水体中的差异较小.但R水样中明显的存在随水体粒径减小,HIX值的k值增加的趋势,表明小粒径水体的腐殖化程度减小较快、大粒径水体较慢,这可能与大粒径水体在降解初期腐殖化程度略有增加有关.
|
图 8 瑶湖水体(L)和支流水体(R)含不同粒径NCs水样中HIX在微生物存在及灭菌条件下的降解率 Fig.8 Degradation rates of HIX in water samples with different sizes of NCs from Lake Yaohu(L) and its tributaries(R) sample with and without microorganisms |
1) 通过PARAFAC模型,瑶湖(L)及其支流(R)水样含不同粒径NCs水体荧光物质随时间变化共解析出4个荧光组分,即C1~C3为类腐殖物质、C4为类蛋白物质.
2) 在初始时刻,两种水样均以类腐殖物质较多、类蛋白物质较少,且均以小粒径NCs(1 kDa~0.45 μm)中的荧光强度更高,但总体来说以R水样荧光组分的荧光强度较高.
3) 两种水样含各粒径NCs水体荧光物质随时间的变化过程表明:①天然水体中荧光物质随时间的减少是微生物降解和自团聚作用共同作用的结果;②由于真溶解态中荧光物质的降解主要受自团聚作用影响,因此在灭菌和对照组中的差别较小,但在中、大粒径水体中荧光物质变化是微生物降解和自团聚作用共同作用结果,因此总体降解速率更快,尤其是类蛋白组分.
4) 荧光参数分析结果表明:①类蛋白物质的降解主要受微生物作用,尤其是大粒径水体中的降解速率较快,并出现类蛋白物质由大粒径向小粒径NCs转移的现象;②类腐殖物质的降解主要是自团聚作用占主导,并可能出现由小粒径向大粒径NCs的转移;③腐殖化指数随降解过程总体呈减小趋势,微生物作用下大粒径水体腐殖化程度呈先增后减趋势,小粒径水体则以较快速率始终呈减小趋势.
| [1] |
Lead JR, Wilkinson KJ. Aquatic colloids and nanoparticles: Current knowledge and future trends. Environmental Chemistry, 2006, 3: 159-171. DOI:10.1071/EN06025 |
| [2] |
Xia B, Qiu H, Knorr KH et al. Occurrence and fate of colloids and colloid-associated metals in a mining-impacted agricultural soil upon prolonged flooding. Journal of Hazardous Materials, 2018, 348: 56-66. DOI:10.1016/j.jhazmat.2018.01.026 |
| [3] |
Yan C, Nie M, Yang Y et al. Effect of colloids on the occurrence, distribution and photolysis of emerging organic contaminants in wastewaters. Journal of Hazardous Materials, 2015, 299: 241-248. DOI:10.1016/j.jhazmat.2015.06.022 |
| [4] |
Yan C, Yang Y, Zhou J et al. Selected emerging organic contaminants in the Yangtze Estuary, China: A comprehensive treatment of their association with aquatic colloids. Journal of Hazardous Materials, 2015, 283: 14-23. DOI:10.1016/j.jhazmat.2014.09.011 |
| [5] |
Xu H, Xu M, Li Y et al. Characterization, origin and aggregation behavior of colloids in eutrophic shallow lake. Water Research, 2018, 142: 176-186. DOI:10.1016/j.watres.2018.05.059 |
| [6] |
Peng X, Kong FX. Intra-habitat heterogeneity of environmental factors regulating bacterioplankton community composition in Lake Taihu, China. Aquatic Microbial Ecology, 2007, 48: 113-122. DOI:10.3354/ame048113 |
| [7] |
Zheng S, Wang P, Wang C et al. Sediment resuspension under action of wind in Taihu Lake, China. International Journal of Sediment Research, 2015, 30: 48-62. DOI:10.1016/S1001-6279(15)60005-1 |
| [8] |
Yang J, Yang Y, Chen R et al. Modeling and evaluating spatial variation of polycyclic aromatic hydrocarbons in urban lake surface sediments in Shanghai. Environmental Pollution, 2018, 235: 1-10. DOI:10.1016/j.envpol.2017.12.032 |
| [9] |
Li C, Zheng X, Zhao F et al. Effects of urban non-point source pollution from Baoding City on Baiyangdian Lake, China. Water, 2017, 9: 249. DOI:10.3390/w9040249 |
| [10] |
Kellerman AM, Dittmar T, Kothawala DN et al. Chemodiversity of dissolved organic matter in lakes driven by climate and hydrology. Nature Communications, 2014, 5: 3804. DOI:10.1038/ncomms4804 |
| [11] |
Kothawala DN, Stedmon CA, Müller RA et al. Controls of dissolved organic matter quality: evidence from a large-scale boreal lake survey. Global Change Biology, 2014, 20: 1101-1114. DOI:10.1111/gcb.12488 |
| [12] |
Maki K, Kim C, Yoshimizu C et al. Autochthonous origin of semi-labile dissolved organic carbon in a large monomictic lake (Lake Biwa): carbon stable isotopic evidence. Limnology, 2010, 11: 143-153. DOI:10.1007/s10201-009-0299-z |
| [13] |
Yao X, Zhang YL, Zhu GW et al. Different degradation mechanism of dissolved organic matter derived from phytoplankton and macrophytes in Lake Taihu, China. Acta Scientiae Circumstantiae, 2014, 34(3): 688-694. [姚昕, 张运林, 朱广伟等. 湖泊草、藻来源溶解性有机质及其微生物降解的差异. 环境科学学报, 2014, 34(3): 688-694.] |
| [14] |
Helms JR, Mao J, Stubbins A et al. Loss of optical and molecular indicators of terrigenous dissolved organic matter during long-term photobleaching. Aquatic Sciences, 2014, 76: 353-373. DOI:10.1007/s00027-014-0340-0 |
| [15] |
Molot LA, Dillon PJ. Photolytic regulation of dissolved organic carbon in northern lakes. Global Biogeochemical Cycles, 1997, 11: 357-365. DOI:10.1029/97GB01198 |
| [16] |
Kothawala DN, von Wachenfeldt E, Koehler B et al. Selective loss and preservation of lake water dissolved organic matter fluorescence during long-term dark incubations. Science of the Total Environment, 2012, 433: 238-246. DOI:10.1016/j.scitotenv.2012.06.029 |
| [17] |
von Wachenfeldt E, Bastviken D, Tranvika LJ. Microbially induced flocculation of allochthonous dissolved organic carbon in lakes. Limnology and Oceanography, 2009, 54: 1811-1818. DOI:10.4319/lo.2009.54.5.1811 |
| [18] |
Vähätalo A. Light, photolytic reactivity and chemical products. In: Likens GE ed. Biogeochemistry of inland waters. Amsterdam: Elsevier/Academic Press, 2010: 37-49.
|
| [19] |
Liu X, Wang YQ, Xu HC et al. Effects of microbial communities on the composition of algae-derived and grass-derived chromophoric dissolved organic matter in eutrophic lake. Ecology and Environment Sciences, 2017, 26: 1403-1409. [刘新, 王友权, 徐华成等. 富营养化湖泊藻型及草型区微生物群落对有色可溶有机物组成的影响. 生态环境学报, 2017, 26: 1403-1409.] |
| [20] |
Chin WC, Orellana MV, Verdugo P. Spontaneous assembly of marine dissolved organic matter into polymer gels. Nature, 1998, 391: 568. DOI:10.1038/35345 |
| [21] |
Kerner M, Hohenberg H, Ertl S et al. Self-organization of dissolved organic matter to micelle-like microparticles in river water. Nature, 2003, 422: 150. DOI:10.1038/nature01469 |
| [22] |
Zhang F, Harir M, Moritz F et al. Molecular and structural characterization of dissolved organic matter during and post cyanobacterial bloom in Taihu by combination of NMR spectroscopy and FTICR mass spectrometry. Water Research, 2014, 57: 280-294. DOI:10.1016/j.watres.2014.02.051 |
| [23] |
Chen Y. Study on relationship between water eutrophication and environmental factors in Yao Lake[Dissertation]. Nanchang: East China Jiaotong University, 2012. [陈杨.瑶湖水体营养化现状及其与环境因子关系的研究[学位论文].南昌: 华东交通大学, 2012. http://cdmd.cnki.com.cn/Article/CDMD-10404-1012040005.htm ]
|
| [24] |
Wang Y. Research on pollution loads and capacity of water environment of Yao Lake Basin[Dissertation]. Nanchang: East China Jiaotong University, 2014. [王亚.瑶湖流域入湖污染负荷及其水环境容量的研究[学位论文].南昌: 华东交通大学, 2014. http://cdmd.cnki.com.cn/article/cdmd-10404-1014068990.htm ]
|
| [25] |
Gao GQ, You JK, Feng YF et al. Evaluation of water environmental quality at Yao Lake in Nanchang City. Journal of Nanchang Institute of Technology, 2019, 38(3): 17-21. [高桂青, 游济康, 冯裕发等. 南昌市瑶湖水环境质量评价. 南昌工程学院学报, 2019, 38(3): 17-21.] |
| [26] |
Gong Y, Tang X, Shao K et al. Dynamics of bacterial abundance and the related environmental factors in large shallow eutrophic Lake Taihu. Journal of Freshwater Ecology, 2017, 32: 133-145. DOI:10.1080/02705060.2016.1248506 |
| [27] |
Ohno T. Fluorescence inner-filtering correction for determining the humification index of dissolved organic matter. Environmental Science & Technology, 2002, 36: 742-746. |
| [28] |
Zepp RG, Sheldon WM, Moran MA. Dissolved organic fluorophores in southeastern US coastal waters: correction method for eliminating Rayleigh and Raman scattering peaks in excitation-emission matrices. Marine Chemistry, 2004, 89: 15-36. DOI:10.1016/j.marchem.2004.02.006 |
| [29] |
Lawaetz AJ, Stedmon CA. Fluorescence intensity calibration using the Raman Scatter peak of water. Applied Spectroscopy, 2009, 63: 936-940. DOI:10.1366/000370209788964548 |
| [30] |
Stedmon CA, Bro R. Characterizing dissolved organic matter fluorescence with parallel factor analysis: a tutorial. Limnology and Oceanography: Methods, 2008, 6: 572-579. DOI:10.4319/lom.2008.6.572 |
| [31] |
Osburn CL, Wigdahl CR, Fritz SC et al. Dissolved organic matter composition and photoreactivity in prairie lakes of the US Great Plains. Limnology and Oceanography, 2011, 56: 2371-2390. DOI:10.4319/lo.2011.56.6.2371 |
| [32] |
Murphy KR, Stedmon CA, Wenig P et al. OpenFluor-an online spectral library of auto-fluorescence by organic compounds in the environment. Analytical Methods, 2014, 6: 658-661. DOI:10.1039/C3AY41935E |
| [33] |
Zhang Y, Liu M, Qin B et al. Photochemical degradation of chromophoric-dissolved organic matter exposed to simulated UV-B and natural solar radiation. Hydrobiologia, 2009, 627: 159-168. DOI:10.1007/s10750-009-9722-z |
| [34] |
Zsolnay A, Baigar E, Jimenez M et al. Differentiating with fluorescence spectroscopy the sources of dissolved organic matter in soils subjected to drying. Chemosphere, 1999, 38: 45-50. DOI:10.1016/S0045-6535(98)00166-0 |
| [35] |
Coble PG. Characterization of marine and terrestrial DOM in seawater using excitation-emission matrix spectroscopy. Marine Chemistry, 1996, 51: 325-346. DOI:10.1016/0304-4203(95)00062-3 |
| [36] |
Liu C, Du Y, Yin H et al. Exchanges of nitrogen and phosphorus across the sediment-water interface influenced by the external suspended particulate matter and the residual matter after dredging. Environmental Pollution, 2019, 246: 207-216. DOI:10.1016/j.envpol.2018.11.092 |
| [37] |
Chen M, Kim SH, Jung HJ et al. Dynamics of dissolved organic matter in riverine sediments affected by weir impoundments: Production, benthic flux, and environmental implications. Water Research, 2017, 121: 150-161. DOI:10.1016/j.watres.2017.05.022 |
| [38] |
Stedmon CA, Markager S, Tranvik L et al. Photochemical production of ammonium and transformation of dissolved organic matter in the Baltic Sea. Marine Chemistry, 2007, 104: 227-240. DOI:10.1016/j.marchem.2006.11.005 |
| [39] |
Murphy KR, Stedmon CA, Waite TD et al. Distinguishing between terrestrial and autochthonous organic matter sources in marine environments using fluorescence spectroscopy. Marine Chemistry, 2008, 108: 40-58. DOI:10.1016/j.marchem.2007.10.003 |
| [40] |
Søndergaard M, Stedmon CA, Borch NH. Fate of terrigenous dissolved organic matter (DOM) in estuaries: Aggregation and bioavailability. Ophelia, 2003, 57: 161-176. DOI:10.1080/00785236.2003.10409512 |
| [41] |
Wünsch UJ, Murphy KR, Stedmon CA. The one-sample PARAFAC approach reveals molecular size distributions of fluorescent components in dissolved organic matter. Environmental Science & Technology, 2017, 51: 11900-11908. |
| [42] |
Chen B, Huang W, Ma S et al. Characterization of chromophoric dissolved organic matter in the littoral zones of eutrophic Lakes Taihu and Hongze during the algal bloom season. Water, 2018, 10: 861. DOI:10.3390/w10070861 |
| [43] |
Seredyńska-Sobecka B, Baker A, Lead JR. Characterisation of colloidal and particulate organic carbon in freshwaters by thermal fluorescence quenching. Water Research, 2007, 41: 3069-3076. DOI:10.1016/j.watres.2007.04.017 |
| [44] |
Xu H, Guo L. Intriguing changes in molecular size and composition of dissolved organic matter induced by microbial degradation and self-assembly. Water Research, 2018, 135: 187-194. DOI:10.1016/j.watres.2018.02.016 |
| [45] |
Fuentes M, González-Gaitano G, García-Mina JM. The usefulness of UV-visible and fluorescence spectroscopies to study the chemical nature of humic substances from soils and composts. Organic Geochemistry, 2006, 37: 1949-1959. DOI:10.1016/j.orggeochem.2006.07.024 |
| [46] |
Hur J, Lee BM, Shin HS. Microbial degradation of dissolved organic matter (DOM) and its influence on phenanthrene-DOM interactions. Chemosphere, 2011, 85: 1360-1367. DOI:10.1016/j.chemosphere.2011.08.001 |
 2020, Vol. 32


