 2022, Vol. 34


(2: 广东粤港供水有限公司, 深圳 518021)
(3: 中国科学院南京地理与湖泊研究所湖泊与环境国家重点实验室, 南京 210008)
(4: 中国科学院大学中丹学院, 北京 101408)
(2: Guangdong Water Supply Company for Hongkong and Macao, Shenzhen 518021, P. R. China)
(3: State Key Laboratory of Lake Science and Environment, Nanjing Institute of Geography and Limnology, Chinese Academy of Sciences, Nanjing 210008, P. R. China)
(4: Sino Danish Center for Science and Education, University of Chinese Academy of Sciences, Beijing 101408, P. R. China)
淡水生态系统在陆地和水体中占比较低,却承载着地球上很高的物种多样性,具有多样化的生态系统功能,为人类提供重要的生态服务功能[1]. 但随着人类活动的加剧,淡水生态系统面临着气候变化与富营养化等多重环境压力,导致生物多样性减少和生态系统功能退化,及淡水生态系统的服务功能降低[2-3]. 为了维持社会经济发展和生态系统可持续性之间的平衡,减缓淡水生态系统的退化,许多国家和地区已经制定了各种法案和相关指令,如联合国的《生物多样性公约》《欧盟水框架指令》《欧盟地下水指令手册》、美国环境保护署发布的《清洁水法案》等. 这些条例使用一系列指标对所监测的水环境进行评估,如使用化学指标来评估环境污染风险水平[4],或使用生物指标来衡量生态系统的状况[5-6]. 其中,关注生态系统功能变化的生物监测与评估是保护、管理和恢复淡水生生态系统的核心.
目前,淡水生态系统的生物评估大多基于形态鉴定的指示生物或类群[7-8],这类方法往往局限于对特定生物类群的观察,例如鱼类[9-11]、水生大型无脊椎动物[12-14]、浮游植物[15-19]、原生生物[20]等,而针对不同指示生物的观察方法几乎没有一致性,因而无法进行不同生物类群间的比较[21]. 不仅如此,传统评估方法主要利用指示生物的出现率和多度信息,忽略了水体环境中“生物”与“生物”,以及“生物”与“环境”间相互作用的复杂关系[22],而这些相互作用却深刻影响着淡水生态系统的生物多样性、生态系统服务功能[23-24]以及生态系统对环境变化的响应[25]. 因此,迫切需要建立一套灵敏且有效的淡水生态系统监测和评价工具[26-28].
生态网络是对生态系统中物质、能量流动进行模拟的结构模型[29],被达尔文称为“树木交错的河岸(tangled bank)”,描述了物种间的相互作用、群落的基本结构以及生态系统的功能和稳定性[30-31],为人们完整地认识生态系统及其组织提供了一个多维度的视角[32]. 生态网络的结构特性揭示了生态系统的组织规律及其面对干扰时发生进化和补偿机制[33-36],并与生态系统的长期动态(例如恢复力和稳定性)密切相关[37-40]. Thompson等提出将生态网络作为协调生物多样性和生态系统功能研究的概念框架[24]. 因此,生态网络及其分析是一种强大且有潜力的生物监测和评价工具[41]. 为了简化复杂的生态网络,通常只用一种主要相互作用关系来表示,可分为营养网络(trophic networks,也称为食物网)和互惠网络(mutualist networks). 然而,在群落尺度上,物种间可以同时以多种方式发生相互作用,共同组成了一个生物共现网络(biological co-occurrence networks)[32]. 生物共现网络是群落水平物种互作的结构模型,通过物种在群落出现及丰度数据,描述了物种间潜在的相互作用、群落的基本结构,反映了群落在生态系统的功能和结构特性.
在这篇综述中,我们首先回顾了淡水生态系统中生物体间不同类型的相互作用,以及这些相互作用被用来定义不同类型的生态网络. 然后重点介绍表现最全面也最容易实现的生物共现网络:(1)如何构建生物共现网络,(2)如何解析共现网络的拓扑结构,以及(3)如何利用生物共现网络重要的拓扑结构参数作为淡水生态系统质量监测的生物指标.
1 淡水生态系统中的生物相互作用在生态系统中,空间和时间上共存的不同物种通过物质、能量和信息的交换而相互联系,形成了复杂的相互作用[42-44],从根本上影响着种群、群落和生态系统过程[45]. 生物多样性丧失、入侵物种以及人类活动都会改变生物相互作用,对重要的生态系统功能产生级联影响[45]. 生物相互作用可分为直接相互作用(direct interaction)和间接相互作用(indirect interaction). 生物间的直接相互作用是指一个物种在没有中间物种参与的情形下对另一个物种产生的正面或负面影响,可以概括为两类:正相互作用(positive interaction)和负相互作用(negative interaction)[46]. 对于生物体而言,正相互作用可能是由于有益的生物相互作用(互惠作用、偏利共生、促进作用或其他原因)产生的,而负相互作用可能是由于对抗性的互作(捕食关系、竞争等原因)造成的[47]. 物种间的正相互作用和负相互作用往往同时存在[48],这种复杂的生态关系可以表示为以物种为节点,以物种之间的相互作用关系为连接的生态网络[49-50]. 物种间的直接相互作用可以借助其他物种导致物种间产生明显的间接相互作用,如营养级联(trophic cascade)、似然竞争(apparent competition)等[46].
1.1 种间的正相互作用种间的正相互作用(positive interspecific interaction)在淡水生态系统中广泛存在,是维持物种丰度和群落结构形成的主要驱动力[45, 51-54]. Stachowicz将其定义为“生物体间的相遇,至少对其中一方有利,但对双方都没有伤害”[55]. 淡水生态系统中的正相互作用主要可分为3种类型:互惠作用(mutualism)、偏利共生(commensalism)以及促进作用(facilitation)[55]. 大多数正相互作用都至少提供或交换3种关键资源或者服务,即营养方面、运输方面或是保护作用中的一种[56]. 此外,促进作用还可通过改善栖息地产生积极效应[57].
1.1.1 互惠作用互惠作用是一种双赢的局面,两个物种都从相互作用中获利. 这种相互作用关系不受种间遗传距离的限制,动植物之间、微生物和动物之间、微生物和植物之间等都可能发生互惠作用[51]. 营养交换关系是互惠作用中最为常见的[51]. 例如淡水海绵(Spongilla lacustris)为其内共生绿藻提供栖所和营养物质,以交换绿藻分泌的葡萄糖[58]. 在互惠作用中,运输能力也是一种常见的交换资源. 例如植物为鱼类提供果实(也是营养交换的一种体现),以交换鱼类进行种子的传播[59-60]. 这种运输方面的互惠作用可发生在多种鱼类和多种植物之间,由此形成了一个互惠网络(mutualist network)[54]. 互惠作用也可提供保护方面的功能. 例如,淡水生态系统中的有根大型植物为底栖生物提供了栖身之所,支持了附生无脊椎动物及其捕食者的多样性[61]. 作为回报,附生的无脊椎动物为大型植物去除附生藻类[62]. 微生物之间也存在互惠作用. 不同类群细菌的相互作用会形成生物膜,生物膜中的细菌可因某些类群的功能而受益. 例如某些细菌种类具有对抗生素的抗性,从而使生物膜中的其他细菌获得耐药性[63].
1.1.2 偏利共生偏利共生指两个不同生物间发生一种对一方有益,而对另一方没有影响的关系[46]. 在偏利共生关系中,一方从互动中获益,但不会给另一方造成损失. 例如摇蚊幼虫可与各种水生昆虫和鱼类共生[64-65]. 这些与之共生的水生生物能为摇蚊幼虫提供“搭便车”服务,称之为携播(phoresy). 生活在这些“载体(carrier)”上为摇蚊幼虫提供了更好的觅食机会,增加其移动性,还能降低其被捕食的风险[66],但对这些“载体”似乎并没有任何影响.
1.1.3 促进作用促进作用通常是一种“单向”(unidirectional)作用,指两生物体相遇时,至少有一方受益,但对任何一方都没有伤害. 若两个物种都从相互作用中受益时,则是互惠作用. 当“一个物种直接使当地环境对另一种生物更有利时”,就会发生促进作用[67]. 例如淡水生态系统中的固着生物,如大型植物和贻贝,除了可为附生于其表面的植物和无脊椎动物提供栖息地外,还具有稳定基质、改善底栖生物生境条件的功能[68-69].
1.2 种间的负相互作用种间的负相互作用(negative interspecific interaction)是指在两个物种的相互作用中,至少对两者的一方会产生不利影响的作用,主要包括捕食作用(predation)、寄生(parasitism)、偏害共生(amensalism)和种间竞争(competition)等[46].
1.2.1 捕食作用通过典型的捕食作用,淡水生态系统中的捕食者可以限制猎物的丰度,改变猎物的大小、行为、年龄结构或其他特征,并可能通过营养网络的级联效应产生间接影响[70]. 例如,底栖食肉鱼类的捕食作用会显著降低牧食性螺类的生物量,从而减少了螺类对附生植物的牧食,对附生植物的生物量产生了间接的促进作用[71]. 捕食作用还会改变猎物所提供的生态功能. 例如,褐鳟(Salmo trutta)通过捕食碎屑生物(Zelandopsyche ingens)而降低了溪流中凋落物的分解率[72].
1.2.2 寄生与典型的捕食作用一样,寄生生物消耗寄主资源,不同的是,寄生生物通常不会杀死寄主[73]. 一些寄生生物对寄主的伤害相对较小,例如淡水贻贝的幼体仅暂时侵染鱼类[74]. 而大部分的寄生作用对寄主的伤害很大. 例如,成年的海七鳃鳗(Petromyzon marinus)对湖鳟(Salvelinus namaycush)的攻击和寄生作用会导致其流失大量的组织和体液,这可能会导致慢性应激反应、继发性伤口感染,甚至死亡[75]. 寄生生物能够改变寄主的行为、颜色或是形态特征,这些改变可能有利于其进一步的传播[76-79].
1.2.3 偏害共生在偏害共生中,一种生物对另一种产生抑制、伤害作用,甚至杀死对方,但本身却也无法从中获得益处或害处[80]. 例如,水体中的铜绿假单胞菌(Pseudomonas aeruginosa)能产生大量的抗生素来抑制其他细菌和藻类的生长[81].
1.2.4 种间竞争种间竞争是研究最多的种间负相互作用,是指两物种或更多物种共同利用相同资源时产生的竞争. 可以发生在同一营养级的物种之间,也可以发生在不同营养级的生物体之间.种间竞争方式可分为利用性竞争(exploitative competition, EC)和干涉性竞争(interference competition, IC)[46]. 例如,水体中食物资源丰富时,不同种类的轮虫和枝角类能够共存,反之则会发生争夺食物的资源利用性竞争[82]. IC则包含广泛的生物相互作用,主要包括化学、生存空间和遭遇竞争[83-84].
似然竞争是物种间的间接相互作用,指某一个物种数量的增加将会导致捕食者数量增加,从而加重了对另一物种的捕食强度,反之亦然[46]. 例如,食鱼动物对拟鲤(Rutilus rutilus)和鲈鱼(Perca fluviatilis)的取食会导致这两种非竞争性鱼类产生似然竞争[85]. 湖泊中,杂食性鱼类会同时在水体和底栖生境取食无脊椎动物,导致了浮游和底栖无脊椎动物之间的似然竞争[86].
1.3 生物相互作用的动态变化不论是正相互作用还是负相互作用,都是动态的,随着环境中生物和非生物因素的变化而变化[52, 54]. 物种间的相互作用是一个从对抗到互惠的连续统一体[52, 87]. 环境变量的改变会使生物相互作用发生转变. 例如,在自然条件下,淡水螯虾与蠕虫是偏利共生关系,只有蠕虫受益[88]. 蠕虫在淡水鳌虾的鳃上生活,以附生寄生虫和生物膜为食[89-90],并降低了其被捕食的风险. 但若水体中污垢(如表面活性物质和有机碎屑颗粒)变多,蠕虫会帮助淡水鳌虾清洗鳃,使淡水鳌虾受益,两者转变为互惠关系[88]. 当然,在污垢变多的情况下,蠕虫的食物资源也更丰富,也将有利于其生长繁殖[91]. 生物因素(如种群密度)的变化也会导致生物相互作用发生转变. 例如,当环境资源有限而蠕虫密度较高时,蠕虫会以淡水鳌虾的鳃为食,使两者转变为寄生关系[90, 92].
2 淡水生态系统中的网络类型淡水生态系统具有很高的生物多样性,存在多个营养级,各个生物体不是孤立存在的,可同时以直接或间接途径与多个其他生物体发生错综复杂的相互作用,构成一个极为复杂的生态网络[29, 42]. 为了简化复杂的交互网络,通常只用一种主要相互作用关系来表示,可分为营养网络(trophic networks,也称为食物网)和互惠网络(mutualist networks). 生物共现网络(biological co-occurrence networks)则展现了环境中所有生物体之间复杂相互作用网络的综合视图[32].
2.1 营养网络营养网络是生态学中研究最早、最多的网络类型,是以物种间的营养关系作为连接的复杂生态网络[93],体现了生态系统中的物质循环和能量流动[24]. 一个营养网络是由多个营养级(trophic level)组成. 营养级呈现了物种在生态系统中的营养生态位,营养级的大小主要取决于初级生产者把能量传递到该级别所需的转换次数. 初级生产者位于生态系统的第一营养级,它们主要利用各种无机形式的能量(如阳光)把CO2转换成生物量;食草动物和食碎屑生物为初级消费者,位于第二营养级;食肉动物以食草动物和食碎屑生物为食物,是第三营养级;捕食食肉动物的动物位居第四营养级. 每一营养级都包含几个,甚至几百个物种[46]. 营养网络的结构非常复杂,主要体现在杂食性和模块性两个方面,其中杂食性增加了营养网络垂直结构(跨营养级的结构)的复杂性,然而模块性不仅增大了营养网络中物种间相互作用的异质性,还增大了营养网络水平(某一营养级内的结构)和垂直结构的复杂性[94]. 鉴于营养网络的高度复杂性,通常使用理论模型的方法来研究其结构和功能[95]. 由于在生态系统水平的研究中,不可能观察或估量系统内所有生物间的营养相互关系,所以基于生态系统水平的营养网络研究本质上都是启发式的(heuristic). 因此,营养网络的构建需要从已发表的文献中收集先验信息(如分类群的相互作用关系、体型和营养习惯等),这无疑是一个费力、艰难而又很难精确的过程[41].
2.2 互惠网络互惠网络体现了生物体间的互惠作用(mutualism),包括植物-传粉者网络、植物-种子散布者网络以及植物-蚂蚁互惠网络[96]. 互惠网络最显著的特征是模块化(modular)和嵌套结构(nested pattern). 模块化组织意味着大多数互惠连接可以包含在若干子集中. 嵌套结构则是指网络中相对特化物种(specialist)的连接伙伴是相对泛化物种(generalist)的连接伙伴的一个子集[97]. 以人们最为熟知的传粉网络为例,蝶类只能够访问少数植物,而蜜蜂则能够为所有植物传粉,蝶类传粉的植物种类只是蜜蜂传粉植物种类的一个子集[98]. 淡水生态系统中的互惠网络研究较少,主要是集中于鱼类对植物种子的传播作用. 鱼类传播种子是一种普遍的生态相互作用,涉及超过275种鱼类和许多植物物种. 通过食用植物果肉,鱼类获得丰富的碳水化合物、脂类和蛋白质来源,因此这些鱼类通常具有较高的流动性,体型较大并具有较长的寿命,在种子散播过程中发挥重要作用[60, 99-100].
2.3 生物共现网络研究基于单一关系类型的网络(如营养网络和互惠网络)简化了群落的概念,使我们能更好地理解群落的组成. 然而,自然群落的物种之间除了营养关系和互惠关系,还存在竞争、寄生等种间相互作用. 因此,这些网络难以体现生态系统真正的复杂性,基于此的分析结果往往比较片面或产生偏差[32]. 与营养网络和互惠网络不同,生物共现网络是群落水平物种互作的结构模型,通过物种在群落出现及丰度数据,描述了物种间潜在的相互作用、群落的基本结构,反映了群落在生态系统的功能和结构特性[101]. 两个物种可以同时以多种方式发生相互作用,所有这些相互作用的综合结果会使得生物体间发生联合进化(正相关关系,即共同出现co-occurrence),或反向进化(负相关关系,即彼此排斥co-exclusion),或缺乏相互作用(可能是生物体间没有相互作用,或是生物体间的多种相互作用的综合效应为零)[47, 102](图 1). 在群落尺度上,这些正相关和负相关关系共同组成了一个共现网络. 生物共现网络的多项拓扑结构属性(如连接度、模块性、中心性等)体现了生物间以及生物与非生物(环境因素)间潜在的交互关系,可能是生态系统健康状态的有力指标,为评价淡水生态系统的健康状态和功能提供了一个生物监测框架[103-104]. 生物群落共现网络的研究已经在多种淡水生态系统中展开,包括湖泊[105]、河流[106]、水库[107-109]等.

|
图 1 物种间相互作用关系(根据Faust等绘制的图片修改[47]) Fig.1 Summary of ecological interactions between different species(modified from Faust et al[47]) |
由于取样问题、物种分类或物种互作的错误鉴定等限制,很难用传统方法在生态系统水平上构建系统内所有生物的共现网络[104, 110]. 环境DNA(environmental DNA,eDNA)宏条形码(metabarcoding)技术可直接从环境介质(如水体、土壤、沉积物等)中提取DNA,采用通用引物扩增eDNA中特定基因片段(即DNA条形码)并通过高通量测序(high-throughput sequencing,又称“下一代”测序技术“next-generation” sequencing technology,NGS)获得DNA条形码序列,然后比对参考物种数据库获取环境中生物的有无或丰度信息,由此可实现对自然中多生物群落的同步监测[110-111]. 多项研究证实eDNA宏条形码技术是评估淡水环境生物多样性的可靠手段[112-113],可用于监测底栖动物[114]、鱼类[115]、两栖动物[116]等. Gibson等的研究表明,基于形态学的传统方法和基于eDNA宏条形码技术的监测方法之间具有良好的一致性[117]. 通过eDNA宏条形码技术能够高效便捷地获取淡水环境中的群落大数据信息,结合环境数据可用于构建生物共现网络[118](图 2).

|
图 2 基于eDNA宏条形码技术构建生物共现网络流程图 Fig.2 Flow chart of constructing biological co-occurrence network based on eDNA metabarcoding technology |
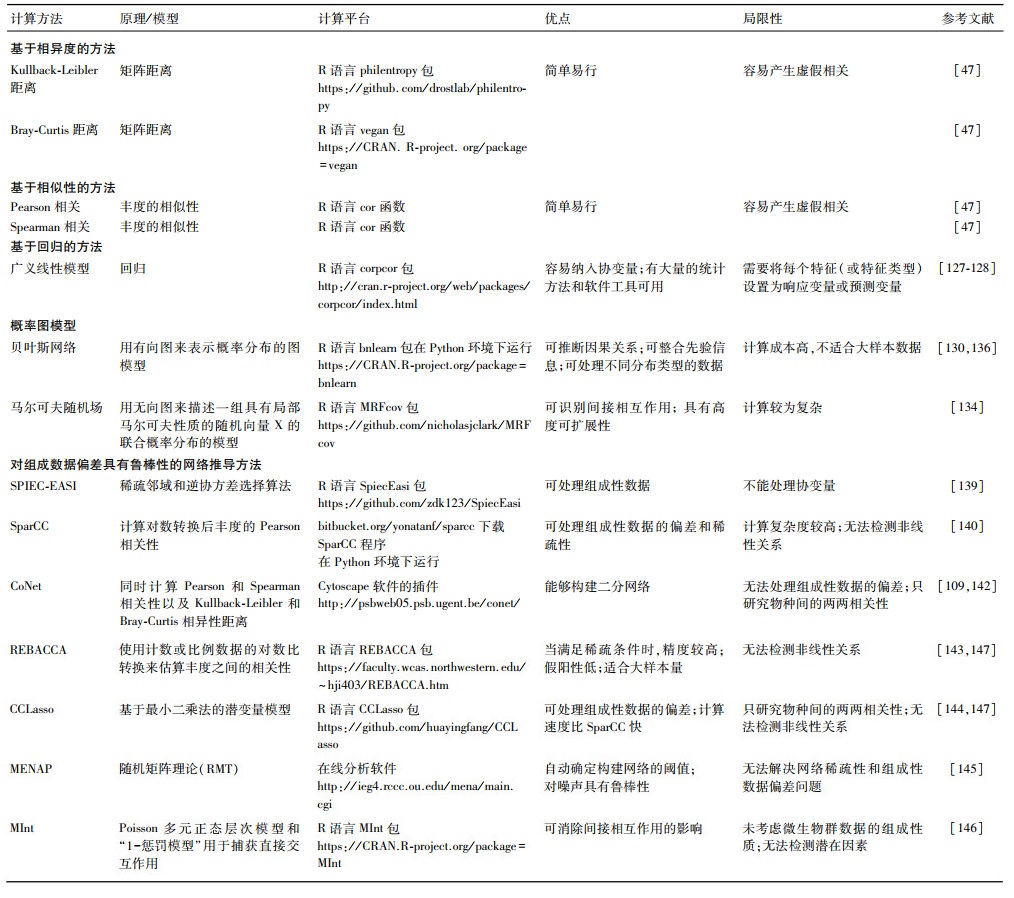
通过测序得到的数据可以用矩阵的形式表现,矩阵的每一行表示一个样品,每一列表示一个物种或类物种[119],数值的高低表示该物种或类物种在样品中含量的高低,矩阵中0或者NA(空缺)表示该物种或类物种没有在该样品中被检测到. 基于这种环境基因组数据构建共现网络的方法很多,而这些方法的效率、精度、计算速度和数据要求各不相同. 简单的如基于成对Pearson或Spearman相关度量的方法,复杂的如基于多元回归和高斯图模型的方法[120]. 这里主要讨论一些构建生物共现网络的常用方法(附表Ⅰ).
3.1 基于相异度的方法以物种或类物种数据构建共现网络最简单快速的方法是使用配对相异度指数,如Bray-Curtis指数或Kullback-Leibler指数. 通常用置换检验(permutation test)评估相异度分数的显著性,所有显著的关系将用于构建网络. 比利时佛兰德生物技术研究所(Flemish institute for biotechnology)的Faust等综合多个指标,如相关性系数(如Spearman指数)、相似性(如交互信息)和相异度(如Kullback-Leibler指数),开发了一套集合流程[47],已用于预测海洋浮游生物群落中的相互作用[121].
3.2 基于相关性的方法这类方法使用相关系数(如Pearson积矩相关系数或Spearman秩相关系数)来检测物种或类物种之间显著的成对相互作用,主要通过物种在不同样本中相对丰度的变化,计算两两物种间的相关系数,然后计算相关显著性P值,结合相关系数和P值筛选数据后绘图,由此形成共现网络[122]. 该方法已成功应用于研究海洋和湖泊等生态系统的微生物共现模式,这些研究不仅探究了微生物之间的联系,还阐明了微生物与环境变化之间的联系[122-123]. 但这类方法存在一定的局限性,如在处理存在大量0的数据集时,低丰度的物种或类物种之间会产生虚假相关关系(spurious correlation),或是对测序得到的组成数据较为敏感[124]. Weiss等[125]以模拟数据和真实数据测试了8种基于相关性方法的性能,并评估了各种方法区分信号和噪声以及检测一系列生态和时间序列关系的能力. 他们总结了各种方法的性能水平和局限性,并确定了稀疏性是这8种方法未能充分解决的关键问题,建议在构建共现网络之前过滤掉极其罕见的物种信息.
3.3 基于回归的方法基于相异度和相似性的分析方法简单易行,是推断生物共现网络最常用的方法,但局限性在于它们只能推断成对关联度量(如Bray-Curtis指数和Pearson系数)之间的关系,没有考虑这些关系是否会被其他变量所影响. 因此,这类分析方法可能会导致虚假相关性[126]. 可使用多元回归分析进行替代,即将某个分类单元的丰度设置为响应变量,使用所有其他分类单元的丰度作为解释变量. 在多元回归模型中,每个分类单元的系数作为两个分类单元相互作用强度的线性度量[127]. 这类方法简单易行,但回归结果的含义可能难以进行合理的解释. 例如,通过多元回归分析预测得到的连接(links)可能并不代表存在什么生物学关联. 此外,回归模型中由于特征数量较多,容易出现过度拟合(overfitting)的问题,过度拟合随着解释变量的数量增加而增加,并且假阳性数量也会相应增加. 可以通过稀疏回归(sparse regression)和交叉验证(cross-validation)来校正过度拟合[127]. 目前,基于回归的方法已被广泛用于构建生物共现网络. 例如,van den Bergh等使用逻辑斯蒂回归模型研究了幼儿上呼吸道中细菌、病毒和其他危险因素之间的关联性[128]. 回归模型主要优势在于能够结合相关的协变量信息,并有多种统计工具适用于该算法,研究者可根据特定的分析需求灵活选择. 然而,大多数基于回归的方法需要将每个特征(或特征类型)设置为响应变量或解释变量. 若所研究对象的基础生物学知识相对匮乏时,这一点较难实现.
3.4 概率图模型概率图模型(probabilistic graphical models, PGMs)是一类用图形模式表达基于概率相关关系的模型,利用计算机科学中离散数据结构的思想,利用概率论有效地计算高维数据中的不确定性[120]. 简而言之,PGMs分别使用概率论和图形来处理不确定性和复杂性. PGMs在形式上是由图结构组成的. 图的每个节点(node)都关联了一个随机变量,而图的边(edge)则被用于编码这些随机变量之间的关系. 最常用的两种PGMs包括贝叶斯网络(Bayesian network)和马尔可夫随机场(Markov random field, MRFs). 两者的主要区别在于采用不同类型的图来表达变量之间的关系:贝叶斯网络采用有向无环图(directed acyclic graph)来表达因果关系,MRFs则采用无向图(undirected graph)来表达变量间的相互作用[120].
贝叶斯网络是沿着有向无环图对联合概率分布进行分解的模型,由代表随机变量的节点(父节点和子节点)和连接这些节点的有向边(由父节点指向子节点)构成. 父节点是“因”,子节点是“果”,两者由单向箭头连接,两节点间会产生一个条件概率值表达节点间的关系强度,没有父节点的用先验概率表达[129-130]. 先验概率是指根据基本知识或前期研究资料所确定的经验性概率. 条件概率是某一个事件(子节点)在另一事件(父节点)已经发生条件下的发生概率.例如,假设父节点A直接影响到子节点B,即A→B,则两节点间的连接强度(即权值)用条件概率P(B∣A)来表示. 若G为一个具有i个节点{X1, X2, …, Xi}的贝叶斯网络,则其联合概率是各个局部条件概率或先验概率的乘积,即:
MRFs采用无向循环图从观测(存在-不存在)数据中获取有关物种相互作用强度的信息,同时展示物种间的间接相互作用[134-135]. MRFs将某一位点(
| p(→y;α,β)∝exp(∑iαiyi+∑⟨ij⟩βijyiyj) | (1) |
式中,
淡水生态系统中的生物体(尤其是微生物)不是独立存在的,且生物群落结构的变化与环境密切相关,使得通过NGS测序所得到的物种或类物种数据是组成数据,即生物计数是相互依赖的,并非完全独立. 这类数据反映的是物种的相对丰度信息而非绝对丰度信息,具有稀疏性和内部关联度高等特征. 使用经典的相关性方法(如Pearson相关系数)对这类数据进行网络推导时常常产生不合理甚至错误的结果. 最近,已开发了许多新的算法来提高网络推导的准确性.
3.5.1 生态关联的稀疏逆协方差估计与统计推断(sparse inverse covariance estimation for ecological association and statistical inference, SPIEC-EASI)SPIEC-EASI是一种从16S rRNA扩增子测序数据集推断微生物生态网络的新工具. SPIEC-EASI将为组成数据分析开发的数据转换与图形化的模型推理框架相结合,该框架假设底层的生态关联网络是稀疏的,并依赖于稀疏邻域和逆协方差选择算法构建网络[139]. 目前,SPIEC-EASI除了应用于16S细菌群落测序,同样适用于对ITS、18S,或者蛋白质组学等数据的分析.
3.5.2 组分数据的稀疏相关分析(sparse correlations for compositional data, SparCC)对于识别群落中生物相互作用,基于物种丰度组分数据的相关性分析是一种常见方法,但是这种分析可能会产生与真实情况相违背的虚假关系,归因于测序获得的物种丰度或基因丰度等很难绝对定量. 群落多样性是调节这种组合效应的剧烈程度的关键因素,由此开发了SparCC方法,它能够将组分数据进行Aitchison对数转换,计算转换后的线性Pearson相关并得到相关系数[140]. SparCC是一种适合测序数据特征的新颖方法,可以推断物种或基因之间的相关性,以及构建物种或基因功能相互作用网络. 例如,Bell等利用SparCC共现网络分析研究了普通小球藻(Chlorella vulgaris)和假单胞菌(Pseudomonas sp.)在(用于生产藻类生物燃料的)露天池塘中的共现关系[141]. 但应谨慎使用基于对数转换的方法,对数转换无法处理微生物组数据中常见的0. 通常用一个很小的计数代替0来解决此问题,但伪计数值的选择可能会严重影响结果.
3.5.3 共现网络法(co-occurence network,CoNet)CoNet会同时计算Pearson和Spearman相关性以及Kullback-Leibler和Bray-Curtis相异性距离. 然后,使用特定的方法将4个分析结果进行合并,得到一个统一的相关系数和P值,校正P值后,得到的结果用于构建共现网络[142]. 另外,CoNet作为Cytoscape软件的插件,其结果可以直接在Cytoscape中可视化呈现,简化了操作过程[109].
3.5.4 基于组成数据的基础协方差的正则化估测方法(regularized estimation of the basis covariance based on compositional data,REBACCA)REBACCA是近年来比较新的一种方法,通过寻找缺陷秩的系统的稀疏解来识别显著的共现模式[143]. 具体而言,REBACCA使用计数或比例数据的对数比转换来估算丰度之间的相关性.
3.5.5 基于套索的组成数据的相关推断方法(correlation inference for compositional data through Lasso,CCLasso)CCLasso是另一种从组成数据中推断相关性的方法[144]. CCLasso对原始组分数据进行对数比变换后,使用具有ℓ1罚分的最小二乘法(即Lasso)通过潜变量模型来推断生物之间的相关性. ℓ1正则化通常用于防止因协变量的共线性或高维性而导致的过度拟合.
3.5.6 分子生态网络分析通道(molecular ecological network analysis pipeline,MENAP)MENAP是一种基于随机矩阵理论(random matrix theory, RMT)的方法,旨在解决阈值的选择问题[145]. 该方法自动识别阈值并在此基础上定义邻接矩阵. 最后由邻接矩阵构建无向网络图. 由此得到的网络是自动定义的,对噪声具有很强的鲁棒性,从而可以解决NGS测序数据的几个常见问题.
3.5.7 微生物相互作用法(microbial interaction,MInt)MInt是一种多元泊松正态分层模型,通过控制Poisson层的混杂预测变量,并使用ℓ1罚分矩阵,捕获多元正态层中直接的微生物相互作用,因此可从宏基因组计数数据中找到分类单元的相互作用[146].
上文简要介绍了目前常用于生物共现网络构建的方法,这些方法在解析生物之间以及生物与环境之间的相互作用方面具有巨大的潜力,但也各有其适用范围以及局限性(附表Ⅰ,图 3). 基于相异度和相关性的分析方法简单易行,是推断生物共现网络最常用的方法,但局限性在于它们只能推断成对关联度量(如Bray-Curtis指数和Pearson系数)之间的关系,没有考虑这些关系是否会被其他变量所影响,容易产生虚假相关性. 基于回归的方法能够结合相关的协变量信息,解决虚假相关的问题,但大多数基于回归的方法需要将每个特征(或特征类型)设置为响应变量或解释变量. 若所研究对象的基础生物学知识相对匮乏时,这一点较难实现. 贝叶斯网络可推断因果关系并整合先验知识进行建模,但计算成本高昂,不适合大样本量数据. MRFs很适合从观测(存在-不存在)数据中获取有关物种相互作用强度的信息,同时展示物种间的间接相互作用,但也存在计算复杂的局限性. 因此,研究者通常需要根据所分析数据的独特特征(如组成性、稀疏性等)量身定制分析工具.

|
图 3 生物共现网络构建流程图(根据Faust等绘制的图片修改[47]) Fig.3 Flow chart of biological co-occurrence network construction(modified from Faust et al[47]) |
生物共现网络构建好以后,可以根据图论指标对其结构特征进行描述[148]. 共现网络由节点(nodes)和连接(links)组成. 节点,即网络线条末端的对象,代表物种或类物种、属、科、类、门、界或是功能群. 节点还可以代表其他感兴趣的环境变量[149]. 连接,即节点之间的边,表示通过统计分析所确定的节点间的重要关系,可根据相互作用关系分为正相关连接和负相关连接[150]. 进一步可使用多种网络分析工具,如Cytoscape[151]或Gephi[152]等对生物共现网络进行可视化,并通过不同的衡量标准来评估共现网络的结构体系. 例如以分类单元(即节点)为中心的评估标准,提供了网络中分类单元的类型、多样性以及相互关系的信息. 另一类评估标准则是以整个网络组织为中心,提供了生态系统中群落复杂性的信息[32].
4.1 基于网络的评价指标 4.1.1 平均度数度(degree)是指某一节点(或分类单元)相邻边(连接)的数量. 平均度数(average degree)是指网络中所有节点的平均连接数量[120].
4.1.2 连接度连接度(connectance)是指网络中已实现的连接数量与潜在连接数量之间的比率,体现了群落的组织层次,是网络复杂性的一个指标[120].
4.1.3 聚类系数聚类系数(clustering coefficient)又称传递性(transitivity),是指一个节点的邻点(和这个节点有连接的节点)间的连接数量与邻点间可能存在的最大连接数量的比值,用来反映一个节点的邻点之间联系的紧密程度,提供了网络连接性的度量. 节点的聚类系数总是介于0~1之间,如果说所有的邻点两两之间都相连,则值为1;如果所有的邻点都没有连接,则值为0[153]. 聚类系数值越高,则说明节点的聚集程度越高. 平均聚类系数是网络中所有节点聚类系数的平均值,Watts等发现具有较高平均聚类系数的网络具有模块结构[153].
4.1.4 节点度分布节点度分布(node degree distribution)是指网络中每个节点的连接数量的分布,在随机网络中,其分布服从泊松分布[154]. 然而,对于大多数生物网络(如无标度网络),常用幂律分布来描述度分布[155]. 节点度分布体现了网络的连通性,常用于推断网络的稳健性(robustness).
4.1.5 模块性模块(module)是指具有密集连接的一组节点,与其他组的节点连接稀疏[156]. 生态位重叠、生境异质性和系统发育相关性可用于解释模块的形成[157-159]. 模块性(modularity)用来衡量一个网络能否自然地划分成模块[160]. 可参考Newman等[150, 160]的方法对网络的模块性值进行计算,一般数值在0~1之间,当模块性值大于0.4时,则认为网络具有模块结构. 现在发现几乎所有已分析的生态网络都是模块化的[161].
4.1.6 平均最短路径长度和网络直径平均最短路径长度(average shortest path length, AL)为网络中所有节点对的平均最短距离. 这里节点间的距离指的是从一个节点到另一个节点要经历的边的最小数目,其中所有节点之间的最大距离称为网络直径(network diameter),平均最短路径长度和网络直径可用于衡量网络的传输性能和效率[120].
4.1.7 网络密度网络密度(network density)是网络中实际存在的边数与可容纳的边数上限的比值. 因此,网络密度是一个从0~1的比率. 该指标反映了网络中节点之间的联系程度,网络密度越大,表明网络节点之间的关系越密切[162].
4.2 基于节点的评价指标可利用图论中的衡量指标(如介数betweenness、度degree、亲和度closeness与特征向量中心性eigenvector centrality,或模块性)来评价节点重要性的不同方面,并可由此来确定代表关键分类群的关键节点(keystone nodes)[163-164].
4.2.1 度中心性度中心性(degree centrality)是网络中每个节点的连接总数,或与其他节点的共享连接总数,这是分类单元水平上复杂性的一个指标[165].
4.2.2 介数中心性介数中心性(betweenness centrality)指一个网络里通过某节点的最短路径条数,反映了该节点连接子网的能力[166]. 节点的介数中心性与其在群落中的丰度无关,因此,一些丰度较低的分类群可能在群落中具有重要的位置. 具有高介数中心性的分类单元是那些在模块之间共享连接,而在模块内部共享连接较少的节点,代表了模块之间资源共享的潜在途径[167]. 如在某一网络中某节点表现出最大的介数中心性,则可认为此节点是维持网络结构的关键节点. 关键节点可能是群落中最具影响力的成员,对于稳定群落结构,维持生态系统功能具有重要作用.
4.2.3 紧密度中心性紧密度中心性(closeness centrality)则表示关键节点与网络中所有其他节点的相对距离,可用于识别与其他节点关联度较大的节点. 紧密度(closeness)包含了网络中所有节点的距离信息[166].
4.2.4 特征向量中心性特征向量中心性(eigenvector centrality)是测量节点对网络影响的一种方式. 针对连接数相同的节点,相邻节点分数更高的节点会比相邻节点分数更低的节点分数高,依据此原则给所有节点分配对应的分数. 特征向量得分较高意味着该节点与许多自身得分较高的节点相连接[166].
4.2.5 模块内连通度和模块间连通度在网络模块化的基础上衍生出了两个重要的节点特征,即模块内连通度(within-module connectivity, Zi)和模块间连通度(among-module connectivity, Pi),其中Zi衡量一个节点在模块中与其他节点的连接程度,值越高表明其在模块中的作用越大,Pi衡量一个节点参与其他模块的程度,值越高表明和其他模块关系越密切[168]. 根据Zi和Pi的值可将节点分为4种类型,包括(1)模块中心点(module hubs),在模块内部具有高连通度的节点,Zi>2.5且Pi < 0.62;(2)连接节点(connectors),在两个模块之间具有高连通度的节点,Zi < 2.5且Pi>0.62;(3)网络中心点(network hubs),在整个网络中具有高连通度的节点,Zi>2.5且Pi>0.62;(4)外围节点,在模块内部和模块之间均不具有高连通度的节点,Zi < 2.5且Pi < 0.62[168]. 在生物共现网络模块中,可根据Zi和Pi值识别关键节点,这些节点往往代表了维持生物群落结构稳定的重要关键物种.
4.2.6 关键节点生物共现网络是无标度(scale-free)的,即网络中的大部分节点只有少数连接,仅有几个节点具有高度连接,这种节点称之为关键节点(keystone nodes)[47, 169]. 综合上述几个中心性指标和模块化指标(Zi和Pi值)可以确定共现网络的关键节点. Steele等将关键节点与关键物种(keystone species)的生态概念联系起来[122].
4.3 网络性质基于随机图论构建起来的分子生态网络都具有小世界(small world)、无标度、模块化(modular)等基本特征[170-171],而这些特性可能对生态系统的结构和功能稳定性有重要影响[172-173].
4.3.1 小世界许多网络具有小世界行为,即两个均匀随机选择的节点之间的典型距离与节点数的对数成比例增长,同时表现出较高的平均聚类系数[153]. 简而言之,小世界网络中的大多数节点间并不相邻,但大多数节点可通过少量的步骤从其他节点相连[170]. 小世界模式有助于系统内不同成员之间高效、快速的通信,因此系统可以对环境变化做出快速响应. 另一方面,小世界模式允许环境扰动迅速波及整个网络,从而改变网络的结构和功能[174].
4.3.2 无标度如果网络中节点的度k满足无标度的幂分布p(k)~k-γ,其中γ为常数,则该网络为无标度网络[155]. 无标度网络的连通性遵循幂律,即网络中仅有少数节点与其他节点有许多连接(有大量的边),但大多数节点只有少数的边[174].
4.3.3 模块化模块化是许多大型复杂系统的固有特征. 在生态学中,模块可以是一组物种,它们之间相互作用强烈,但与其他模块中的物种相互作用很小[175]. 生态群落的模块性可能反映了生境异质性、物理接触、功能联系、差异选择和/或密切相关物种的系统发育聚类[159]. 模块及其组成物种甚至可能是共同进化的关键单元[174]. 许多生态网络都具有模块化(层次化)的拓扑结构,这种网络可以划分为若干模块(组),同一模块内的节点间紧密连接,而不同模块间的节点之间连接稀疏[176]. 各个模块间的分层组织确保了模块和枢纽节点间快速的通信,因此网络的模块化特性将有助于降低环境变化对整个系统的影响[173].
5 生物共现网络拓扑结构参数可作为淡水生态系统健康评价指标在进行生态系统状态评价时,应从能反映其组成、结构和功能等多方面来选择评价指标. 理论上理想的评价指标需满足以下几个要求(1)简单直观,即能直接反映生态系统的内在特性;(2)评估方法标准化,使用一些相对简单的特征参数作为评估指标;(3)可操作性,即评估设备易于设置,成本适中,基于现有的技术手段能够获取相关参数;(4)对环境变化具有敏感性和特异性;(5)评估结果可用于指导管理决策[32]. 传统的淡水生态系统生物监测和评估方法都是基于劳动密集型的形态学观察,成本高,鉴定困难,难以得到广泛应用. 随着eDNA宏条形码技术的不断完善和测序成本的持续下降,可简便快捷地利用eDNA数据构建生物共现网络(图 2). 分析网络和群落在空间和时间上的变化,可以检测和解释生态系统功能和服务的变化[177-181]. 这种分析方法不依赖于节点本身的物种特性和生态特征[182],避免了物种鉴定的困难. 不仅如此,环境因子也可作为节点放入生物共现网络中,以研究环境因子与物种以及群落组成的关系[148]. 生物共现网络的拓扑结构特征提供了与生物群落结构有关的信息,可用于评估群落对自然扰动和人为影响的抵抗力以及恢复力[181, 183]. 因此,生物共现网络的拓扑结构参数可能是生态系统功能和完整性的有力指标[178, 184-186]. 近年来,人们开展了一系列研究,从生物群落数据中推断生物共现网络,以探索网络结构特性(如连接度、中心性、模块性等)与生态系统功能之间的联系[187-191],并用以评估环境变化对生态系统的影响. 因此可以利用生物共现网络拓扑结构的一些关键参数作为淡水生态系统健康的评价指标.
5.1 网络复杂性指标研究表明,生物共现网络拓扑结构的变化会影响生态系统的功能和稳定性[93, 192-193]. 网络复杂性越高代表网络稳定性越高,可能说明生态系统越稳定[32, 193]. 例如,Zappelini等发现,人为导致的土壤汞污染将显著降低土壤微生物共现网络的复杂性[188]. Lupatini等也发现土地利用对网络的连接度和网络密度有影响[191]. 在淡水生态系统中,人为影响使得网络的连接度降低[194-196],并使得正向连接的比例降低[194, 197]. Al等对真核微生物共现网络的分析发现,城市水体污染会对网络的复杂性和相异性产生显著的不利影响[198]. 综合这些研究结果会发现,当环境受到干扰时,生物共现网络的复杂性会降低. 因此,代表网络复杂性的拓扑结构参数可作为淡水生态系统健康的潜在评价指标.
5.2 模块性生物共现网络由多个节点和连接组成,较难直观地获取信息,可使用模块划分等方法简化网络[199]. 模块化是生态系统结构的重要特征,可识别高度连接的分类群,反映了复杂网络中的协同关系、竞争互动和生态位分化[159]以及一些进化特性[200]. 将网络划分为多个模块可以揭示执行不同功能的不同节点组[201]. 例如,Zhao等对南京城区6个湖泊中浮游细菌群落的研究中将共现网络分为几个主要的模块[199]. 同一模块中的细菌连接紧密,具有相似生态位,共同行使某一功能特性. 研究还发现,不同的环境因子影响不同的模块. Abdullah等发现,城市水体污染会打破微生物共现网络结构的模块化,相较于正常水体,网络模块性指数显著下降[198]. Ford等也发现,海洋鱼类共现网络模块化更高的群落对物种损失等干扰的抵抗力更强[183]. 对亚热带水库蓝藻水华的研究中发现,蓝藻生物量的变化强烈影响了水库微型真核浮游生物共现网络的模块性,不同模块对应于蓝藻水华生消的不同时期,表明蓝藻水华生消可导致环境异质性,创造不同的生态位,从而改变了水库微型真核浮游生物的共现模式[107-108]. 上述研究均说明,共现网络模块性能够体现环境变化对生物群落组成的影响[202-204],模块性的增加使得共现网络的结构更加稳定,体现了更高的生物群落稳定性[30, 193]. 因此,模块性指数也可作为淡水生态系统健康的潜在评价指标.
5.3 关键节点网络结构中的关键节点可能代表了对生态系统具有重要作用的关键物种(keystone species),可通过生物共现网络的中心性指标、模块内连通度(Zi)和模块间连通度(Pi)对其进行推断[122]. 例如,Ford等选择向量中心性指标确定了澳大利亚海域鱼类共现网络中的关键物种是该海域的特有品种[183]. Yang等综合Zi和Pi值,确定了4个细菌类群(假单胞菌属Pseudomonas、寡养单胞菌属Stenotrophobacter、博斯氏菌属Bosea和生丝微菌属Hyphomicrobium)和5个真核藻类类群(单胞藻属Monodus、四链藻属Tetradesmus、栅藻属Scenedesmus、单针藻属Monoraphidium和双眉藻属Amphora)是维持城市河流微生物共现网络稳定性的关键物种[205]. 利用中心性指标可以确定亚热带水库蓝藻水华暴发时期的关键真核微生物[107-108],并且Liu等还发现这些高中心性节点与蓝藻生物量的相关性也越高,表明这些浮游生物在共现网络中可能发挥了决定性作用[108]. 研究表明,关键物种(节点)为共现网络结构提供了完整性,移除这些物种将导致网络结构的巨大改变[206-207]甚至崩溃[208]. 因此,在生态系统监测中应优先关注关键物种,以避免生态系统内的连锁灭绝或生态系统功能发生改变[37, 209-210]. 因此,生物共现网络中能够代表关键物种的关键节点也可作为淡水生态系统健康的潜在评价指标. 例如,真核微生物共现网络中关键物种的相对丰度会随着城市水体污染程度的升高而下降,这些关键物种可作为水质状态监测和诊断的生物指标[198].
综上所述,体现网络复杂性的指标(如平均度数、连接度和网络密度等),体现关键物种的关键节点指标(中心性指标、Zi和Pi值)以及共现网络模块性参数可能是监测淡水生态系统状态的合适指标(图 4).

|
图 4 生物共现网络的部分结构参数可能是监测淡水生态系统健康状态的合适指标 Fig.4 Some topological metrics of biological co-occurrence networks could be used as indicators of the state and stability of freshwater ecosystem |
虽然利用生物共现网络进行淡水生态系统质量监测和评价具有很大的应用前景,但基于eDNA宏条形码技术推断网络结构特性与生态系统状态和功能的联系仍处于初级阶段[121, 190, 195-196]. 一些方法学问题限制了共现网络的稳健推断.
首先,eDNA宏条形码技术尚未标准化和规范化. 主要表现在(1)eDNA采样及提取方法缺乏统一的标准,使用不同方法获得的研究结果之间没有可对比性[211]. 此外,在eDNA样品采集和提取过程中应尽量避免环境污染和样品之间的交叉污染. 尽量增大样本量和设置重复(尤其是生物重复)以保证样品中物种分布的全面性[212]. (2)通用引物的选择. 目前用于原核生物识别的DNA条形码区域主要为核基因的16S rDNA基因. 而用于真核生物不同分类群的DNA条形码区域则差别很大. 例如,用于真核浮游植物的包括核基因的ITS、18S rDNA、28S rDNA和叶绿体rbcL基因等[213-214];用于鱼类的包括核基因的12S rDNA[215]、16S rDNA[216],线粒体细胞色素b(Cytb)基因[217];用于识别两栖类的包括12S rDNA[218]、Cytb基因[219]、COI基因[220];用于识别节肢动物的有COI基因[221]等. 不同通用引物的扩增效率以及对应数据库的物种覆盖率差别较大. 因此研究者需对监测的水体系统中物种组成有所了解,选择适宜的通用引物应用于不同分类群eDNA的扩增. (3)测序平台和测序深度的选择. 由于不同生态系统中物种丰富度不同,所需的测序深度也有所不同,因此不同研究中样品的测序深度相差较大. (4)通过eDNA估计物种丰度或生物量的准确性. 虽然现已证明eDNA在评估物种存在与否方面特别有效,但使用eDNA检测估计物种丰度或生物量(尤其是大型生物)尚处于起步阶段,迫切需要建立分析eDNA浓度与物种丰度之间关系的全面而普适性的方法[222].
其次,前文简要介绍了目前常用于生物共现网络构建的方法,这些方法在解析生物之间以及生物与环境之间的相互作用方面具有巨大的潜力,但也各有其适用范围以及局限性. 研究者通常需要根据所分析数据的独特特征(如组成性、稀疏性等)量身定制分析工具. 幸运的是,已开发了越来越多的统计方法用于生物共现网络的构建,这些新方法有可能解决目前阻碍测序数据分析的一些主要限制[126].
第三,尽管生物共现网络已广泛应用于同一营养级内生物种类(群落)的分析,如微生物群落、鱼类或真核浮游生物等,而在淡水生态系统中同时存在多个营养级,迫切需要发展新的分析技术以展现不同营养级之间的关系. 不仅如此,生物共现网络分析只是体现了生物之间和生物与非生物(环境因素)间潜在的交互关系,研究者还需要通过行为观察、操纵实验或生物自然史等来确定网络模型识别出的相互作用的确切性质. 因此,在实际应用时,还应考虑不同淡水水体环境的背景特征,综合使用各项生物共现网络指标并结合传统的评价指标和其他群落梯度分析方法,如广义非相似性模拟(generalized dissimilarity modelling, GDM)[223],对淡水生态系统状态进行更全面的评价.
上述几点均影响了生物共现网络分析在淡水生态系统生物监测和评价中的推广应用. 不仅如此,推断稳健网络需要更多的样品,这也增加了时间和经济成本[181, 224]. 然而,这些限制和局限性也促进了研究者不断完善研究设计和开发合适的分析工具. 这些设计和技术发展有可能使得生物共现网络作为淡水生态系统生物监测和评价指标得以实现.
7 结论开发快速有效的淡水生态系统监测和评估工具,对保护淡水生态环境具有重要意义. 传统的基于形态学鉴定的评估方法存在耗时长、劳力投入高的限制,不利于实施大规模的生物监测. 基于eDNA宏条形码技术能够高效便捷地获取淡水环境中的群落大数据信息,借助于生物共现网络构建与分析技术,为研究淡水生态系统的响应和功能提供了一个生物监测和评价框架. 尤其是生物共现网络的拓扑结构参数可与特定的生态系统状态相关联,可作为早期的、敏感的生物指标,是一种很有应用前景的评估淡水生态系统状态和稳定性的工具. 更可靠的生态系统评估,需要基于多营养级的下一代网络构建与分析技术的发展.
8 附录附表Ⅰ见电子版(DOI: 10.18307/2022.0601).
| 附表Ⅰ 构建生物共现网络的常用方法 Appendix Tab.Ⅰ Overview of co-occurrence network methods |
| [1] |
Dudgeon D, Arthington AH, Gessner MO et al. Freshwater biodiversity: Importance, threats, status and conservation challenges. Biological Reviews, 2006, 81(2): 163-182. DOI:10.1017/S1464793105006950 |
| [2] |
Cazzolla GR. Freshwater biodiversity: A review of local and global threats. International Journal of Environmental Studies, 2016, 73(6): 887-904. DOI:10.1080/00207233.2016.1204133 |
| [3] |
Hu SJ, Niu ZG, Chen YF et al. Global wetlands: Potential distribution, wetland loss, and status. Science of the Total Environment, 2017, 586: 319-327. DOI:10.1016/j.scitotenv.2017.02.001 |
| [4] |
Zaghloul A, Saber M, El-Dewany C. Chemical indicators for pollution detection in terrestrial and aquatic ecosystems. Bulletin of the National Research Centre, 2019, 43: 156. DOI:10.1186/s42269-019-0203-x |
| [5] |
Dale VH, Beyeler SC. Challenges in the development and use of ecological indicators. Ecological Indicators, 2001, 1(1): 3-10. DOI:10.1016/S1470-160X(01)00003-6 |
| [6] |
Davies SP, Jackson SK. The biological condition gradient: A descriptive model for interpreting change in aquatic ecosystems. Ecological Applications, 2006, 16(4): 1251-1266. DOI:10.1890/1051-0761(2006)016[1251:TBCGAD]2.0.CO;2 |
| [7] |
Hering D, Borja A, Jones JI et al. Implementation options for DNA-based identification into ecological status assessment under the European Water Framework Directive. Water Research, 2018, 138: 192-205. DOI:10.1016/j.watres.2018.03.003 |
| [8] |
Wang WM, Cai WW. Index of biotic integrity and its application to aquatic ecological health assessment. Journal of Ecology and Rural Environment, 2016, 32(4): 517-524. [王为木, 蔡旺炜. 生物完整性指数及其在水生态健康评价中的应用进展. 生态与农村环境学报, 2016, 32(4): 517-524.] |
| [9] |
Pont D, Hugueny B, Beier U et al. Assessing River biotic condition at a continental scale: A European approach using functional metrics and fish assemblages. Journal of Applied Ecology, 2006, 43(1): 70-80. DOI:10.1111/j.1365-2664.2005.01126.x |
| [10] |
Schenekar T, Schletterer M, Lecaudey LA et al. Reference databases, primer choice, and assay sensitivity for environmental metabarcoding: Lessons learnt from a re-evaluation of an eDNA fish assessment in the Volga headwaters. River Research and Applications, 2020, 36(7): 1004-1013. DOI:10.1002/rra.3610 |
| [11] |
Sales NG, Wangensteen OS, Carvalho DC et al. Space-time dynamics in monitoring neotropical fish communities using eDNA metabarcoding. Science of the Total Environment, 2021, 754: 142096. DOI:10.1016/j.scitotenv.2020.142096 |
| [12] |
Hajibabaei M, Shokralla S, Zhou X et al. Environmental barcoding: A next-generation sequencing approach for biomonitoring applications using river benthos. PLoS One, 2011, 6(4): e17497. DOI:10.1371/journal.pone.0017497 |
| [13] |
Hajibabaei M, Spall JL, Shokralla S et al. Assessing biodiversity of a freshwater benthic macroinvertebrate community through non-destructive environmental barcoding of DNA from preservative ethanol. BMC Ecology, 2012, 12(1): 28. DOI:10.1186/1472-6785-12-28 |
| [14] |
Frühe L, Cordier T, Dully V et al. Supervised machine learning is superior to indicator value inference in monitoring the environmental impacts of salmon aquaculture using eDNA metabarcodes. Molecular Ecology, 2021, 30(13): 2988-3006. DOI:10.1111/mec.15434 |
| [15] |
Reavie ED, Jicha TM, Angradi TR et al. Algal assemblages for large river monitoring: Comparison among biovolume, absolute and relative abundance metrics. Ecological Indicators, 2010, 10(2): 167-177. DOI:10.1016/j.ecolind.2009.04.009 |
| [16] |
Poikane S, Kelly M, Cantonati M. Benthic algal assessment of ecological status in European lakes and rivers: Challenges and opportunities. Science of the Total Environment, 2016, 568: 603-613. DOI:10.1016/j.scitotenv.2016.02.027 |
| [17] |
Visco JA, Apothéloz-Perret-Gentil L, Cordonier A et al. Environmental monitoring: Inferring the diatom index from next-generation sequencing data. Environmental Science & Technology, 2015, 49(13): 7597-7605. DOI:10.1021/es506158m |
| [18] |
Ma TT, Fan YM, Li KY et al. Ecological health assessment of main estuaries of Lake Taihu based on phytoplankton index of biotic integrity. Journal of Ecology and Rural Environment, 2021, 37(4): 501-508. [马廷婷, 范亚民, 李宽意等. 基于浮游植物完整性指数的太湖主要河口生态健康评价. 生态与农村环境学报, 2021, 37(4): 501-508.] |
| [19] |
Shen Q, Yu JJ, Chen H et al. Planktonic index of biotic integrity(P-IBI) for water source assessment. Journal of Hydroecology, 2012, 33(2): 26-31. [沈强, 俞建军, 陈晖等. 浮游生物完整性指数在浙江水源地水质评价中的应用. 水生态学杂志, 2012, 33(2): 26-31. DOI:10.15928/j.1674-3075.2012.02.013] |
| [20] |
Pawlowski J, Esling P, Lejzerowicz F et al. Environmental monitoring through protist next-generation sequencing metabarcoding: Assessing the impact of fish farming on benthic foraminifera communities. Molecular Ecology Resources, 2014, 14(6): 1129-1140. DOI:10.1111/1755-0998.12261 |
| [21] |
Pawlowski J, Kelly-Quinn M, Altermatt F et al. The future of biotic indices in the ecogenomic era: Integrating (e)DNA metabarcoding in biological assessment of aquatic ecosystems. Science of the Total Environment, 2018, 637/638: 1295-1310. DOI:10.1016/j.scitotenv.2018.05.002 |
| [22] |
Friberg N, Bonada N, Bradley DC et al. Biomonitoring of human impacts in freshwater ecosystems: The good, the bad and the ugly. Advances in Ecological Research, 2011, 44: 1-68. DOI:10.1016/B978-0-12-374794-5.00001-8 |
| [23] |
Kremen C. Managing ecosystem services: What do we need to know about their ecology?. Ecology Letters, 2005, 8(5): 468-479. DOI:10.1111/j.1461-0248.2005.00751.x |
| [24] |
Thompson RM, Brose U, Dunne JA et al. Food webs: Reconciling the structure and function of biodiversity. Trends in Ecology & Evolution, 2012, 27(12): 689-697. DOI:10.1016/j.tree.2012.08.005 |
| [25] |
Tylianakis JM, Tscharntke T, Lewis OT. Habitat modification alters the structure of tropical host-parasitoid food webs. Nature, 2007, 445: 202-205. DOI:10.1038/nature05429 |
| [26] |
Carpenter SR, Cole JJ, Pace ML et al. Early warnings of regime shifts: A whole-ecosystem experiment. Science, 2011, 332(6033): 1079-1082. DOI:10.1126/science.1203672 |
| [27] |
Barnosky AD, Hadly EA, Bascompte J et al. Approaching a state shift in Earth's biosphere. Nature, 2012, 486: 52-58. DOI:10.1038/nature11018 |
| [28] |
Ratajczak Z, Carpenter SR, Ives AR et al. Abrupt change in ecological systems: Inference and diagnosis. Trends in Ecology & Evolution, 2018, 33(7): 513-526. DOI:10.1016/j.tree.2018.04.013 |
| [29] |
Han BP. Progresses on the analysis of econetwork. Chinese Journal of Ecology, 1993, 12(6): 41-45. [韩博平. 生态网络分析的研究进展. 生态学杂志, 1993, 12(6): 41-45.] |
| [30] |
Montoya JM, Pimm SL, Solé RV. Ecological networks and their fragility. Nature, 2006, 442: 259-264. DOI:10.1038/nature04927 |
| [31] |
Han BP. On the diversity of trophic structures and processes in ecosystems. Ecological Modelling, 1998, 107(1): 51-62. DOI:10.1016/S0304-3800(97)00201-9 |
| [32] |
Karimi B, Maron PA, Chemidlin-Prevost Boure N et al. Microbial diversity and ecological networks as indicators of environmental quality. Environmental Chemistry Letters, 2017, 15(2): 265-281. DOI:10.1007/s10311-017-0614-6 |
| [33] |
Cohen JE. Food webs and the dimensionality of trophic niche space. PNAS, 1977, 74(10): 4533-4536. DOI:10.1073/pnas.74.10.4533 |
| [34] |
Woodward G, Perkins DM, Brown LE. Climate change and freshwater ecosystems: Impacts across multiple levels of organization. Philosophical Transactions of the Royal Society B: Biological Sciences, 2010, 365(1549): 2093-2106. DOI:10.1098/rstb.2010.0055 |
| [35] |
Woodward G, Benstead JP, Beveridge OS et al. Ecological networks in a changing climate. Advances in Ecological Research, 2010, 42: 71-138. DOI:10.1016/B978-0-12-381363-3.00002-2 |
| [36] |
Lu X, Gray C, Brown LE et al. Drought rewires the cores of food webs. Nature Climate Change, 2016, 6: 875-878. DOI:10.1038/nclimate3002 |
| [37] |
Dunne JA, Williams RJ, Martinez ND. Network structure and biodiversity loss in food webs: Robustness increases with connectance. Ecology Letters, 2002, 5(4): 558-567. DOI:10.1046/j.1461-0248.2002.00354.x |
| [38] |
Memmott J, Waser NM, Price MV. Tolerance of pollination networks to species extinctions. Proceedings of the Royal Society of London Series B: Biological Sciences, 2004, 271(1557): 2605-2611. DOI:10.1098/rspb.2004.2909 |
| [39] |
Ledger ME, Brown LE, Edwards FK et al. Extreme climatic events alter aquatic food webs: A synthesis of evidence from a mesocosm drought experiment. Advances in Ecological Research, 2013, 48: 343-395. DOI:10.1016/B978-0-12-417199-2.00006-9 |
| [40] |
Oliver TH, Heard MS, Isaac NJB et al. Biodiversity and resilience of ecosystem functions. Trends in Ecology & Evolution, 2015, 30(11): 673-684. DOI:10.1016/j.tree.2015.08.009 |
| [41] |
Compson ZG, Monk WA, Curry CJ et al. Linking DNA metabarcoding and text mining to create network-based biomonitoring tools: A case study on boreal wetland macroinvertebrate communities. Advances in Ecological Research, 2018, 59: 33-74. DOI:10.1016/bs.aecr.2018.09.001 |
| [42] |
Fath BD, Patten BC. Network synergism: Emergence of positive relations in ecological systems. Ecological Modelling, 1998, 107(2/3): 127-143. DOI:10.1016/S0304-3800(97)00213-5 |
| [43] |
Ulanowicz RE. Quantitative methods for ecological network analysis. Computational Biology and Chemistry, 2004, 28(5/6): 321-339. DOI:10.1016/j.compbiolchem.2004.09.001 |
| [44] |
Fath BD, Scharler UM, Ulanowicz RE et al. Ecological network analysis: Network construction. Ecological Modelling, 2007, 208(1): 49-55. DOI:10.1016/j.ecolmodel.2007.04.029 |
| [45] |
Albertson LK, MacDonald MJ, Tumolo BB et al. Uncovering patterns of freshwater positive interactions using meta-analysis: Identifying the roles of common participants, invasive species and environmental context. Ecology Letters, 2021, 24(3): 594-607. DOI:10.1111/ele.13664 |
| [46] |
Molles MCJ. Ecology concepts and applications, sixth Edition. New York: McGraw-Hill Education, 2013.
|
| [47] |
Faust K, Raes J. Microbial interactions: from networks to models. Nature Reviews Microbiology, 2012, 10(8): 538-550. DOI:10.1038/nrmicro2832 |
| [48] |
Maestre FT, Bautista S, Cortina J. Positive, negative, and net effects in grass-shrub interactions in Mediterranean semiarid grasslands. Ecology, 2003, 84(12): 3186-3197. DOI:10.1890/02-0635 |
| [49] |
García-Callejas D, Molowny-Horas R, Araújo MB. The effect of multiple biotic interaction types on species persistence. Ecology, 2018, 99(10): 2327-2337. DOI:10.1002/ecy.2465 |
| [50] |
Proulx SR, Promislow DEL, Phillips PC. Network thinking in ecology and evolution. Trends in Ecology & Evolution, 2005, 20(6): 345-353. DOI:10.1016/j.tree.2005.04.004 |
| [51] |
Boucher DH, James S, Keeler KH. The ecology of mutualism. Annual Review of Ecology and Systematics, 1982, 13: 315-347. DOI:10.1146/annurev.es.13.110182.001531 |
| [52] |
Bronstein JL. Conditional outcomes in mutualistic interactions. Trends in Ecology & Evolution, 1994, 9(6): 214-217. DOI:10.1016/0169-5347(94)90246-1 |
| [53] |
Bronstein JL. Our Current understanding of mutualism. The Quarterly Review of Biology, 1994, 69(1): 31-51. DOI:10.1086/418432 |
| [54] |
Silknetter S, Creed RP, Brown BL et al. Positive biotic interactions in freshwaters: A review and research directive. Freshwater Biology, 2020, 65(4): 811-832. DOI:10.1111/fwb.13476 |
| [55] |
Stachowicz JJ. Mutualism, facilitation, and the structure of ecological communities: Positive interactions play a critical, but underappreciated, role in ecological communities by reducing physical or biotic stresses in existing habitats and by creating new habitats on which many species depend. BioScience, 2001, 51(3): 235-246. DOI:10.1641/0006-3568(2001)051[0235:MFATSO]2.0.CO;2 |
| [56] |
Hoeksema J, Bruna E. Context-dependent outcomes of mutualistic interactions. In Bronstein JL ed. Mutualism. Oxford: Oxford University Press, 2015: 181-202.
|
| [57] |
Bronstein JL. Mutualism and symbiosis. In: Levin SA ed. Princeton guide to ecology. Princeton: Princeton University Press, 2009: 233-238.
|
| [58] |
Skelton J, Strand M. Trophic ecology of a freshwater sponge (Spongilla lacustris) revealed by stable isotope analysis. Hydrobiologia, 2013, 709(1): 227-235. DOI:10.1007/s10750-013-1452-6 |
| [59] |
Parolin P, Wittmann F, Ferreira LV. Fruit and seed dispersal in Amazonian floodplain trees-a review. Ecotropica, 2013, 19: 15-32. |
| [60] |
Horn MH, Correa SB, Parolin P et al. Seed dispersal by fishes in tropical and temperate fresh waters: The growing evidence. Acta Oecologica, 2011, 37(6): 561-577. DOI:10.1016/j.actao.2011.06.004 |
| [61] |
Taniguchi H, Nakano S, Tokeshi M. Influences of habitat complexity on the diversity and abundance of epiphytic invertebrates on plants. Freshwater Biology, 2003, 48(4): 718-728. DOI:10.1046/j.1365-2427.2003.01047.x |
| [62] |
Brönmark C. Interactions between epiphytes, macrophytes and freshwater snails: A review. Journal of Molluscan Studies, 1989, 55(2): 299-311. DOI:10.1093/mollus/55.2.299 |
| [63] |
Rodríguez-Martínez JM, Pascual A. Antimicrobial resistance in bacterial biofilms. Reviews in Medical Microbiology, 2006, 17(3): 65-75. DOI:10.1097/01.revmedmi.0000259645.20603.63 |
| [64] |
Pennuto CM. Incidence of chironomid phoretics on hellgrammites in streams of southern Maine. Northeastern Naturalist, 1997, 4(4): 285. DOI:10.2307/3858613 |
| [65] |
Freihofer WC, Neil EH. Commensalism between midge larvae (Diptera: Chironomidae) and catfishes of the families Astroblepidae and Loricariidae. Copeia, 1967(1): 39-45. DOI:10.2307/1442173 |
| [66] |
Tokeshi M. On the evolution of commensalism in the Chironomidae. Freshwater Biology, 1993, 29(3): 481-489. DOI:10.1111/j.1365-2427.1993.tb00782.x |
| [67] |
Bruno JF, Stachowicz JJ, Bertness MD. Inclusion of facilitation into ecological theory. Trends in Ecology & Evolution, 2003, 18(3): 119-125. DOI:10.1016/S0169-5347(02)00045-9 |
| [68] |
Vaughn CC, Nichols SJ, Spooner DE. Community and foodweb ecology of freshwater mussels. Journal of the North American Benthological Society, 2008, 27(2): 409-423. DOI:10.1899/07-058.1 |
| [69] |
Gregg WW, Rose FL. Influences of aquatic macrophytes on invertebrate community structure, guild structure, and microdistribution in streams. Hydrobiologia, 1985, 128(1): 45-56. DOI:10.1007/BF00008939 |
| [70] |
Holomuzki JR, Feminella JW, Power ME. Biotic interactions in freshwater benthic habitats. Journal of the North American Benthological Society, 2010, 29(1): 220-244. DOI:10.1899/08-044.1 |
| [71] |
Bronmark C. Effects of tench and perch on interactions in a freshwater, benthic food chain. Ecology, 1994, 75(6): 1818-1828. DOI:10.2307/1939640 |
| [72] |
Hamish GS, McIntosh AR. Indirect effects of predatory trout on organic matter processing in detritus-based stream food webs. Oikos, 2006, 112(1): 31-40. DOI:10.1111/j.0030-1299.2006.14219.x |
| [73] |
Jokela J, Lively CM, Taskinen J et al. Effect of starvation on parasite-induced mortality in a freshwater snail (Potamopyrgus antipodarum). Oecologia, 1999, 119(3): 320-325. DOI:10.1007/s004420050792 |
| [74] |
Watters GT. A brief look at freshwater mussel (Unionacea) biology. In: Farris JL, Hassel JHV eds. Freshwater bivalve ecotoxicology. New York: CRC Press, 2006: 51-64.
|
| [75] |
Bergstedt RA, Schneider CP, O'Gorman R. Lethality of sea lamprey attacks on lake trout in relation to location on the body surface. Transactions of the American Fisheries Society, 2001, 130(2): 336-340. DOI:10.1577/1548-8659(2001)1300336:LOSLAO>2.0.CO;2 |
| [76] |
Dezfuli BS, Maynard BJ, Wellnitz TA. Activity levels and predator detection by amphipods infected with an acanthocephalan parasite, Pomphorhynchus laevis. Folia Parasitologica, 2003, 50(2): 129-134. DOI:10.14411/fp.2003.023 |
| [77] |
Zimmer M, Geisler S, Walter S et al. Fluorescence in Asellus aquaticus (Isopoda: Asellota): A first approach. Evolutionary Ecology Research, 2002, 4(2): 181-187. |
| [78] |
Bakker TCM, Mazzi D, Zala S. Parasite-induced changes in behavior and color make Gammarus pulex more prone to fish predation. Ecology, 1997, 78(4): 1098-1104. DOI:10.1890/0012-9658(1997)078[1098:PICIBA]2.0.CO;2 |
| [79] |
Levri EP, Dillard J, Martin T. Trematode infection correlates with shell shape and defence morphology in a freshwater snail. Parasitology, 2005, 130(Pt 6): 699-708. DOI:10.1017/s0031182005007286 |
| [80] |
Chaneton EJ, Bonsall MB. Enemy-mediated apparent competition: Empirical patterns and the evidence. Oikos, 2000, 88(2): 380-394. DOI:10.1034/j.1600-0706.2000.880217.x |
| [81] |
Dakhama A, Noüe J, Lavoie MC. Isolation and identification of antialgal substances produced by Pseudomonas aeruginosa. Journal of Applied Phycology, 1993, 5(3): 297-306. DOI:10.1007/BF02186232 |
| [82] |
Huang L, Xi YL. Research advances in interspecific competition and influencing factors between rotifers and cladocerans. Acta Ecologica Sinica, 2020, 40(19): 6720-6728. [黄林, 席贻龙. 轮虫和枝角类的种间竞争及其影响因子研究进展. 生态学报, 2020, 40(19): 6720-6728. DOI:10.5846/stxb201902090242] |
| [83] |
Schoener TW. Field experiments on interspecific competition. The American Naturalist, 1983, 122(2): 240-285. DOI:10.1086/284133 |
| [84] |
MacIsaac HJ, Gilbert JJ. Discrimination between exploitative and interference competition between Cladocera and Keratella cochlearis. Ecology, 1991, 72(3): 924-937. DOI:10.2307/1940594 |
| [85] |
Persson L. Competition, predation and environmental factors as structuring forces in freshwater fish communities: Sumari (1971) revisited. Canadian Journal of Fisheries and Aquatic Sciences, 1997, 54(1): 85-88. DOI:10.1139/f96-250 |
| [86] |
Vander Zanden MJ, Vadeboncoeur Y. Fishes as integrators of benthic and pelagic food webs in lakes. Ecology, 2002, 83(8): 2152-2161. DOI:10.1890/0012-9658(2002)083[2152:FAIOBA]2.0.CO;2 |
| [87] |
Ewald PW. Transmission modes and evolution of the parasitism-mutualism continuuma. Annals of the New York Academy of Sciences, 1987, 503(1): 295-306. DOI:10.1111/j.1749-6632.1987.tb40616.x |
| [88] |
Lee JH, Kim TW, Choe JC. Commensalism or mutualism: Conditional outcomes in a branchiobdellid-crayfish symbiosis. Oecologia, 2009, 159(1): 217-224. DOI:10.1007/s00442-008-1195-7 |
| [89] |
Brown BL, Creed RP, Dobson WE. Branchiobdellid annelids and their crayfish hosts: Are they engaged in a cleaning symbiosis?. Oecologia, 2002, 132(2): 250-255. DOI:10.1007/s00442-002-0961-1 |
| [90] |
Brown BL, Creed RP, Skelton J et al. The fine line between mutualism and parasitism: Complex effects in a cleaning symbiosis demonstrated by multiple field experiments. Oecologia, 2012, 170(1): 199-207. DOI:10.1007/s00442-012-2280-5 |
| [91] |
Thomas MJ, Creed RP, Brown BL. The effects of environmental context and initial density on symbiont populations in a freshwater cleaning symbiosis. Freshwater Science, 2013, 32(4): 1358-1366. DOI:10.1899/12-187.1 |
| [92] |
Creed RP, Brown BL. Multiple mechanisms can stabilize a freshwater mutualism. Freshwater Science, 2018, 37(4): 760-768. DOI:10.1086/700560 |
| [93] |
Dunne JA, Williams RJ, Martinez ND. Food-web structure and network theory: The role of connectance and size. Proceedings of the National Academy of Sciences of the United States of America, 2002, 99(20): 12917-12922. DOI:10.1073/pnas.192407699 |
| [94] |
Wang SP. Food web structure and functioning: Theoretical advances and outlook. Biodiversity Science, 2020, 28(11): 1391-1404. [王少鹏. 食物网结构与功能: 理论进展与展望. 生物多样性, 2020, 28(11): 1391-1404. DOI:10.17520/biods.2020240] |
| [95] |
Moore JC, De Ruiter PC. Energetic food webs: An analysis of real and model ecosystems. New York: Oxford University Press, 2012.
|
| [96] |
Hagen M, Kissling WD, Rasmussen C et al. Biodiversity, species interactions and ecological networks in a fragmented world. Advances in Ecological Research, 2012, 46: 89-120. DOI:10.1016/B978-0-12-396992-7.00002-2 |
| [97] |
Cai W, Snyder J, Hastings A et al. Mutualistic networks emerging from adaptive niche-based interactions. Nature Communications, 2020, 11: 5470. DOI:10.1038/s41467-020-19154-5 |
| [98] |
Fang Q, Huang SQ. Progress in pollination networks: Network structure and dynamics. Biodiversity Science, 2012, 20(3): 300-307. [方强, 黄双全. 传粉网络的研究进展: 网络的结构和动态. 生物多样性, 2012, 20(3): 300-307. DOI:10.3724/SP.J.1003.2012.08026] |
| [99] |
Weiss B, Zuanon JAS, Piedade MTF. Viability of seeds consumed by fishes in a lowland forest in the Brazilian central Amazon. Tropical Conservation Science, 2016, 9(4): 194008291667612. DOI:10.1177/1940082916676129 |
| [100] |
Messeder JVS, Silveira FAO, Cornelissen TG et al. Frugivory and seed dispersal in a hyperdiverse plant clade and its role as a keystone resource for the Neotropical fauna. Annals of Botany, 2021, 127(5): 577-595. DOI:10.1093/aob/mcaa189 |
| [101] |
D'Amen M, Mod HK, Gotelli NJ et al. Disentangling biotic interactions, environmental filters, and dispersal limitation as drivers of species co-occurrence. Ecography, 2018, 41(8): 1233-1244. DOI:10.1111/ecog.03148 |
| [102] |
Gross K. Positive interactions among competitors can produce species-rich communities. Ecology Letters, 2008, 11(9): 929-936. DOI:10.1111/j.1461-0248.2008.01204.x |
| [103] |
Leese L, Altermatt F, Bouchez A et al. DNAqua-Net: Developing new genetic tools for bioassessment and monitoring of aquatic ecosystems in Europe. Research Ideas and Outcomes, 2016, 2: 1-24. DOI:10.3897/rio.2.e11321 |
| [104] |
Evans DM, Kitson JJN, Lunt DH et al. Merging DNA metabarcoding and ecological network analysis to understand and build resilient terrestrial ecosystems. Functional Ecology, 2016, 30(12): 1904-1916. DOI:10.1111/1365-2435.12659 |
| [105] |
Liu MK, Han X, Tong J et al. Mutual environmental drivers of the community composition, functional attributes and co-occurrence patterns of bacterioplankton in the composite aquatic ecosystem of Taihu watershed in China. FEMS Microbiology Ecology, 2020, 96(8): fiaa137. DOI:10.1093/femsec/fiaa137 |
| [106] |
Hu AY, Ju F, Hou LY et al. Strong impact of anthropogenic contamination on the co-occurrence patterns of a riverine microbial community. Environmental Microbiology, 2017, 19(12): 4993-5009. DOI:10.1111/1462-2920.13942 |
| [107] |
Xue Y, Chen H, Yang JR et al. Distinct patterns and processes of abundant and rare eukaryotic plankton communities following a reservoir cyanobacterial bloom. The ISME Journal, 2018, 12: 2263-2277. DOI:10.1038/s41396-018-0159-0 |
| [108] |
Liu L, Chen H, Liu M et al. Response of the eukaryotic plankton community to the cyanobacterial biomass cycle over 6 years in two subtropical reservoirs. The ISME Journal, 2019, 13: 2196-2208. DOI:10.1038/s41396-019-0417-9 |
| [109] |
Zhang JX, Chen Y, Huo Y et al. Eutrophication increases deterministic processes and heterogeneity of co-occurrence networks of bacterioplankton metacommunity assembly at a regional scale in tropical coastal reservoirs. Water Research, 2021, 202: 117460. DOI:10.1016/j.watres.2021.117460 |
| [110] |
Gibson RH, Knott B, Eberlein T et al. Sampling method influences the structure of plant-pollinator networks. Oikos, 2011, 120(6): 822-831. DOI:10.1111/j.1600-0706.2010.18927.x |
| [111] |
Zhang XW. Environmental DNA shaping a new era of ecotoxicological research. Environmental Science & Technology, 2019, 53(10): 5605-5612. DOI:10.1021/acs.est.8b06631 |
| [112] |
Bohmann K, Evans A, Gilbert MTP et al. Environmental DNA for wildlife biology and biodiversity monitoring. Trends in Ecology & Evolution, 2014, 29(6): 358-367. DOI:10.1016/j.tree.2014.04.003 |
| [113] |
Seymour M. Rapid progression and future of environmental DNA research. Communications Biology, 2019, 2(1): 80. DOI:10.1038/s42003-019-0330-9 |
| [114] |
Mächler E, Deiner K, Steinmann P et al. Utility of environmental DNA for monitoring rare and indicator macroinvertebrate species. Freshwater Science, 2014, 33(4): 1174-1183. DOI:10.1086/678128 |
| [115] |
Doi H, Inui R, Akamatsu Y et al. Environmental DNA analysis for estimating the abundance and biomass of stream fish. Freshwater Biology, 2017, 62(1): 30-39. DOI:10.1111/fwb.12846 |
| [116] |
Bálint M, Nowak C, Márton O et al. Accuracy, limitations and cost efficiency of eDNA-based community survey in tropical frogs. Molecular Ecology Resources, 2018, 18(6): 1415-1426. DOI:10.1111/1755-0998.12934 |
| [117] |
Gibson JF, Shokralla S, Curry C et al. Large-scale biomonitoring of remote and threatened ecosystems via high-throughput sequencing. PLoS One, 2015, 10(10): e0138432. DOI:10.1371/journal.pone.0138432 |
| [118] |
Seymour M, Edwards FK, Cosby BJ et al. Executing multi-taxa eDNA ecological assessment via traditional metrics and interactive networks. Science of the Total Environment, 2020, 729: 138801. DOI:10.1016/j.scitotenv.2020.138801 |
| [119] |
Schloss PD, Westcott SL. Assessing and improving methods used in operational taxonomic unit-based approaches for 16S rRNA gene sequence analysis. Applied and Environmental Microbiology, 2011, 77(10): 3219-3226. DOI:10.1128/aem.02810-10 |
| [120] |
Layeghifard M, Hwang DM, Guttman DS. Disentangling interactions in the microbiome: A network perspective. Trends in Microbiology, 2017, 25(3): 217-228. DOI:10.1016/j.tim.2016.11.008 |
| [121] |
Lima-Mendez G, Faust K, Henry N et al. Determinants of community structure in the global plankton interactome. Science, 2015, 348(6237). DOI:10.1126/science.1262073 |
| [122] |
Steele JA, Countway PD, Xia L et al. Marine bacterial, archaeal and protistan association networks reveal ecological linkages. The ISME Journal, 2011, 5(9): 1414-1425. DOI:10.1038/ismej.2011.24 |
| [123] |
Eiler A, Heinrich F, Bertilsson S. Coherent dynamics and association networks among lake bacterioplankton taxa. The ISME Journal, 2012, 6(2): 330-342. DOI:10.1038/ismej.2011.113 |
| [124] |
Chen EZ, Li HZ. A two-part mixed-effects model for analyzing longitudinal microbiome compositional data. Bioinformatics, 2016, 32(17): 2611-2617. DOI:10.1093/bioinformatics/btw308 |
| [125] |
Weiss S, Van Treuren W, Lozupone C et al. Correlation detection strategies in microbial data sets vary widely in sensitivity and precision. The ISME Journal, 2016, 10(7): 1669-1681. DOI:10.1038/ismej.2015.235 |
| [126] |
Jiang D, Armour CR, Hu CX et al. Microbiome multi-omics network analysis: Statistical considerations, limitations, and opportunities. Frontiers in Genetics, 2019, 10: 995. DOI:10.3389/fgene.2019.00995 |
| [127] |
Faust K, Sathirapongsasuti JF, Izard J et al. Microbial co-occurrence relationships in the human microbiome. PLoS Computational Biology, 2012, 8(7): e1002606. DOI:10.1371/journal.pcbi.1002606 |
| [128] |
van den Bergh MR, Biesbroek G, Rossen JWA et al. Associations between pathogens in the upper respiratory tract of young children: Interplay between viruses and bacteria. PLoS One, 2012, 7(10): e47711. DOI:10.1371/journal.pone.0047711 |
| [129] |
Noble J, Koski TJT. A review of Bayesian networks and structure learning. Mathematica Applicanda, 2012, 40(1). DOI:10.14708/ma.v40i1.278 |
| [130] |
Sazal MR, Ruiz-Perez D, Cickovski T et al. Inferring relationships in microbiomes from signed Bayesian networks. In: 2018 IEEE 8th International Conference on Computational Advances in Bio and Medical Sciences. October 18-20, 2018, Las Vegas, NV, USA. IEEE, 2018: 1. DOI: 10.1109/ICCABS.2018.8542086.
|
| [131] |
Korb KB, Nicholson AE. The causal interpretation of Bayesian networks. In: Holmes DE, Jain LC eds. Innovations in Bayesian networks: Theory and applications. Berlin, Heidelberg: Springer, 2008: 83-116. DOI: 10.1007/978-3-540-85066-3_4
|
| [132] |
Ni Y, Stingo FC, Baladandayuthapani V. Integrative Bayesian network analysis of genomic data. Cancer Informatics, 2014, 13(Suppl 2): 39-48. DOI:10.4137/CIN.S13786 |
| [133] |
Neto EC, Keller MP, Attie AD et al. Causal graphical models in systems genetics: A unified framework for joint inference of causal network and genetic architecture for correlated phenotypes. The Annals of Applied Statistics, 2010, 4(1): 320-339. DOI:10.1214/09-aoas288 |
| [134] |
Clark NJ, Wells K, Lindberg O. Unravelling changing interspecific interactions across environmental gradients using Markov random fields. Ecology, 2018, 99(6): 1277-1283. DOI:10.1002/ecy.2221 |
| [135] |
Harris DJ. Inferring species interactions from co-occurrence data with Markov networks. Ecology, 2016, 97(12): 3308-3314. DOI:10.1002/ecy.1605 |
| [136] |
Delalandre L, Montesinos-Navarro A. Can co-occurrence networks predict plant-plant interactions in a semi-arid gypsum community?. Perspectives in Plant Ecology, Evolution and Systematics, 2018, 31: 36-43. DOI:10.1016/j.ppees.2018.01.001 |
| [137] |
Murphy KP. Machine learning: A probabilistic perspective. Cambridge: The MIT Press, 2012.
|
| [138] |
Drton M, Maathuis MH. Structure learning in graphical modeling. Annual Review of Statistics and Its Application, 2017, 4(1): 365-393. DOI:10.1146/annurev-statistics-060116-053803 |
| [139] |
Kurtz ZD, Müller CL, Miraldi ER et al. Sparse and compositionally robust inference of microbial ecological networks. PLoS Computational Biology, 2015, 11(5): e1004226. DOI:10.1371/journal.pcbi.1004226 |
| [140] |
Friedman J, Alm EJ. Inferring correlation networks from genomic survey data. PLoS Computational Biology, 2012, 8(9): e1002687. DOI:10.1371/journal.pcbi.1002687 |
| [141] |
Bell TAS, Prithiviraj B, Wahlen BD et al. A lipid-accumulating alga maintains growth in outdoor, alkaliphilic raceway pond with mixed microbial communities. Frontiers in Microbiology, 2016, 6: 1480. DOI:10.3389/fmicb.2015.01480 |
| [142] |
Faust K, Raes J. CoNet app: Inference of biological association networks using Cytoscape. F1000 Research, 2016, 5: 1519. DOI:10.12688/f1000research.9050.2 |
| [143] |
Ban YG, An LL, Jiang HM. Investigating microbial co-occurrence patterns based on metagenomic compositional data. Bioinformatics, 2015, 31(20): 3322-3329. DOI:10.1093/bioinformatics/btv364 |
| [144] |
Fang HY, Huang CC, Zhao HY et al. CCLasso: correlation inference for compositional data through Lasso. Bioinformatics, 2015, 31(19): 3172-3180. DOI:10.1093/bioinformatics/btv349 |
| [145] |
Deng Y, Jiang YH, Yang YF et al. Molecular ecological network analyses. BMC Bioinformatics, 2012, 13: 113. DOI:10.1186/1471-2105-13-113 |
| [146] |
Biswas S, McDonald M, Lundberg DS et al. Learning microbial interaction networks from metagenomic count data. Journal of Computational Biology, 2016, 23(6): 526-535. DOI:10.1089/cmb.2016.0061 |
| [147] |
Hirano H, Takemoto K. Difficulty in inferring microbial community structure based on co-occurrence network approaches. BMC Bioinformatics, 2019, 20(1): 329. DOI:10.1186/s12859-019-2915-1 |
| [148] |
Tang YS, Dai TJ, Su ZG et al. A tripartite microbial-environment network indicates how crucial microbes influence the microbial community ecology. Microbial Ecology, 2020, 79(2): 342-356. DOI:10.1007/s00248-019-01421-8 |
| [149] |
Röttjers L, Faust K. From hairballs to hypotheses-biological insights from microbial networks. FEMS Microbiology Reviews, 2018, 42(6): 761-780. DOI:10.1093/femsre/fuy030 |
| [150] |
Newman MEJ. The structure and function of complex networks. SIAM Review, 2003, 45(2): 167-256. DOI:10.1137/s003614450342480 |
| [151] |
Smoot ME, Ono K, Ruscheinski J et al. Cytoscape 2.8: New features for data integration and network visualization. Bioinformatics, 2011, 27(3): 431-432. DOI:10.1093/bioinformatics/btq675 |
| [152] |
Cherven KA. Mastering Gephi network visualization: Produce advanced network graphs in Gephi and gain valuable insights into your network datasets. Birmingham, UK: Packt Publishing, 2015.
|
| [153] |
Watts DJ, Strogatz SH. Collective dynamics of 'small-world' networks. Nature, 1998, 393(6684): 440-442. DOI:10.1038/30918 |
| [154] |
Erdös P, Rényi A. On the evolution of random graphs. Publications of the Mathematical Institute of the Hungarian Academy of Sciences, 1960, 5: 17-61. |
| [155] |
Barabási AL, Albert R. Emergence of scaling in random networks. Science, 1999, 286(5439): 509-512. DOI:10.1126/science.286.5439.509 |
| [156] |
Bissett A, Brown MV, Siciliano SD et al. Microbial community responses to anthropogenically induced environmental change: Towards a systems approach. Ecology Letters, 2013, 16: 128-139. DOI:10.1111/ele.12109 |
| [157] |
Chaffron S, Rehrauer H, Pernthaler J et al. A global network of coexisting microbes from environmental and whole-genome sequence data. Genome Research, 2010, 20(7): 947-959. DOI:10.1101/gr.104521.109 |
| [158] |
Freilich S, Kreimer A, Meilijson I et al. The large-scale organization of the bacterial network of ecological co-occurrence interactions. Nucleic Acids Research, 2010, 38(12): 3857-3868. DOI:10.1093/nar/gkq118 |
| [159] |
Olesen JM, Bascompte J, Dupont YL et al. The modularity of pollination networks. PNAS, 2007, 104(50): 19891-19896. DOI:10.1073/pnas.0706375104 |
| [160] |
Newman MEJ. Modularity and community structure in networks. PNAS, 2006, 103(23): 8577-8582. DOI:10.1073/pnas.0601602103 |
| [161] |
Dormann CF, Fründ J, Schaefer HM. Identifying causes of patterns in ecological networks: Opportunities and limitations. Annual Review of Ecology, Evolution, and Systematics, 2017, 48: 559-584. DOI:10.1146/annurev-ecolsys-110316-022928 |
| [162] |
Luke DA. A User's Guide to Network Analysis in R. Springer International Publishing, 2015. DOI:10.1007/978-3-319-23883-8
|
| [163] |
Jiang YJ, Li SZ, Li RP et al. Plant cultivars imprint the rhizosphere bacterial community composition and association networks. Soil Biology and Biochemistry, 2017, 109: 145-155. DOI:10.1016/j.soilbio.2017.02.010 |
| [164] |
Banerjee S, Kirkby CA, Schmutter D et al. Network analysis reveals functional redundancy and keystone taxa amongst bacterial and fungal communities during organic matter decomposition in an arable soil. Soil Biology and Biochemistry, 2016, 97: 188-198. DOI:10.1016/j.soilbio.2016.03.017 |
| [165] |
Mamet SD, Redlick E, Brabant M et al. Structural equation modeling of a winnowed soil microbiome identifies how invasive plants re-structure microbial networks. The ISME Journal, 2019, 13(8): 1988-1996. DOI:10.1038/s41396-019-0407-y |
| [166] |
Newman M, Barabási AL, Watts DJ. The structure and dynamics of networks. Princeton: Princeton University Press, 2011.
|
| [167] |
Dallas TA, Han BA, Nunn CL et al. Host traits associated with species roles in parasite sharing networks. Oikos, 2019, 128(1): 23-32. DOI:10.1111/oik.05602 |
| [168] |
Guimerà R, Nunes Amaral LA. Functional cartography of complex metabolic networks. Nature, 2005, 433(7028): 895-900. DOI:10.1038/nature03288 |
| [169] |
Barberán A, Bates ST, Casamayor EO et al. Using network analysis to explore co-occurrence patterns in soil microbial communities. The ISME Journal, 2012, 6(2): 343-351. DOI:10.1038/ismej.2011.119 |
| [170] |
Chen J, Dai MF, Wen ZX et al. Trapping on modular scale-free and small-world networks with multiple hubs. Physica A: Statistical Mechanics and Its Applications, 2014, 393: 542-552. DOI:10.1016/j.physa.2013.08.060 |
| [171] |
Shen F, Huang R, Zeng J et al. Progress of the molecular ecology network analysis. Environmental Science & Technology, 2016, 39(S1): 94-98, 173. [沈烽, 黄睿, 曾巾等. 分子生态网络分析研究进展. 环境科学与技术, 2016, 39(S1): 94-98, 173.] |
| [172] |
Barabási AL, Oltvai ZN. Network biology: Understanding the cell's functional organization. Nature Reviews Genetics, 2004, 5(2): 101-113. DOI:10.1038/nrg1272 |
| [173] |
Kitano H. Biological robustness. Nature Reviews Genetics, 2004, 5(11): 826-837. DOI:10.1038/nrg1471 |
| [174] |
Zhou JZ, Deng Y, Luo F et al. Functional molecular ecological networks. mBio, 2010, 1(4): e00169-e00110. DOI:10.1128/mBio.00169-10 |
| [175] |
Bascompte J, Stouffer DB. The assembly and disassembly of ecological networks. Philosophical Transactions of the Royal Society B: Biological Sciences, 2009, 364(1524): 1781-1787. DOI:10.1098/rstb.2008.0226 |
| [176] |
Alon U. Biological networks: The tinkerer as an engineer. Science, 2003, 301(5641): 1866-1867. DOI:10.1126/science.1089072 |
| [177] |
Baird DJ, Hajibabaei M. Biomonitoring 2.0: A new paradigm in ecosystem assessment made possible by next-generation DNA sequencing. Molecular Ecology, 2012, 21(8): 2039-2044. DOI:10.1111/j.1365-294X.2012.05519.x |
| [178] |
Bohan DA, Vacher C, Tamaddoni-Nezhad A et al. Next-generation global biomonitoring: Large-scale, automated reconstruction of ecological networks. Trends in Ecology & Evolution, 2017, 32(7): 477-487. DOI:10.1016/j.tree.2017.03.001 |
| [179] |
Derocles SAP, Bohan DA, Dumbrell AJ et al. Biomonitoring for the 21st century: Integrating next-generation sequencing into ecological network analysis. Advances in Ecological Research, 2018, 58: 1-62. DOI:10.1016/bs.aecr.2017.12.001 |
| [180] |
Makiola A, Compson ZG, Baird DJ et al. Key questions for next-generation biomonitoring. Frontiers in Environmental Science, 2020, 7: 197. DOI:10.3389/fenvs.2019.00197 |
| [181] |
Barroso-Bergadà D, Pauvert C, Vallance J et al. Microbial networks inferred from environmental DNA data for biomonitoring ecosystem change: Strengths and pitfalls. Molecular Ecology Resources, 2021, 21(3): 762-780. DOI:10.1111/1755-0998.13302 |
| [182] |
Bock C, Jensen M, Forster D et al. Factors shaping community patterns of protists and bacteria on a European scale. Environmental Microbiology, 2020, 22(6): 2243-2260. DOI:10.1111/1462-2920.14992 |
| [183] |
Ford BM, Roberts JD. Evolutionary histories impart structure into marine fish heterospecific co-occurrence networks. Global Ecology and Biogeography, 2019, 28(9): 1310-1324. DOI:10.1111/geb.12934 |
| [184] |
Gray C, Baird DJ, Baumgartner S et al. FORUM: Ecological networks: The missing links in biomonitoring science. Journal of Applied Ecology, 2014, 51(5): 1444-1449. DOI:10.1111/1365-2664.12300 |
| [185] |
Delmas E, Besson M, Brice MH et al. Analysing ecological networks of species interactions. Biological Reviews, 2019, 94(1): 16-36. DOI:10.1111/brv.12433 |
| [186] |
Schloter M, Nannipieri P, Sørensen SJ et al. Microbial indicators for soil quality. Biology and Fertility of Soils, 2018, 54(1): 1-10. DOI:10.1007/s00374-017-1248-3 |
| [187] |
Zhou JZ, Deng Y, Luo F et al. Phylogenetic molecular ecological network of soil microbial communities in response to elevated CO2. mBio, 2011, 2(4): e00122-e00111. DOI:10.1128/mBio.00122-11 |
| [188] |
Zappelini C, Karimi B, Foulon J et al. Diversity and complexity of microbial communities from a chlor-alkali tailings dump. Soil Biology and Biochemistry, 2015, 90: 101-110. DOI:10.1016/j.soilbio.2015.08.008 |
| [189] |
Pérez-Valera E, Goberna M, Faust K et al. Fire modifies the phylogenetic structure of soil bacterial co-occurrence networks. Environmental Microbiology, 2017, 19(1): 317-327. DOI:10.1111/1462-2920.13609 |
| [190] |
Pauvert C, Vallance J, Delière L et al. Inferred microbial networks lack replicability: consequences for next-generation biomonitoring. BioRxiv, 2020. DOI:10.1101/642199 |
| [191] |
Lupatini M, Suleiman AKA, Jacques RJS et al. Network topology reveals high connectance levels and few key microbial genera within soils. Frontiers in Environmental Science, 2014, 2: 10. DOI:10.3389/fenvs.2014.00010 |
| [192] |
Thébault E, Fontaine C. Stability of ecological communities and the architecture of mutualistic and trophic networks. Science, 2010, 329(5993): 853-856. DOI:10.1126/science.1188321 |
| [193] |
Yuan MM, Guo X, Wu L et al. Climate warming enhances microbial network complexity and stability. Nature Climate Change, 2021, 11(4): 343-348. DOI:10.1038/s41558-021-00989-9 |
| [194] |
Laroche O, Pochon X, Tremblay LA et al. Incorporating molecular-based functional and co-occurrence network properties into benthic marine impact assessments. FEMS Microbiology Ecology, 2018, 94(11): 167. DOI:10.1093/femsec/fiy167 |
| [195] |
Lawes JC, Dafforn KA, Clark GF et al. Multiple stressors in sediments impact adjacent hard substrate habitats and across biological domains. Science of the Total Environment, 2017, 592: 295-305. DOI:10.1016/j.scitotenv.2017.03.083 |
| [196] |
Li FL, Peng Y, Fang WD et al. Application of environmental DNA metabarcoding for predicting anthropogenic pollution in rivers. Environmental Science & Technology, 2018, 52(20): 11708-11719. DOI:10.1021/acs.est.8b03869 |
| [197] |
Chen GZ, Jiang XY, Hu Y. Characteristics of bacterial communities and their co-occurrence networks in lake ecosystem with different trophic states. Research of Environmental Sciences, 2020, 33(2): 375-384. [陈光哲, 姜星宇, 胡洋. 不同营养程度湖泊中细菌群落组成及其分子生态网络特征. 环境科学研究, 2020, 33(2): 375-384.] |
| [198] |
Abdullah AM, Xue YY, Xiao P et al. DNA metabarcoding reveals the significant influence of anthropogenic effects on microeukaryotic communities in urban waterbodies. Environmental Pollution, 2021, 285: 117336. DOI:10.1016/j.envpol.2021.117336 |
| [199] |
Zhao DY, Shen F, Zeng J et al. Network analysis reveals seasonal variation of co-occurrence correlations between Cyanobacteria and other bacterioplankton. Science of the Total Environment, 2016, 573: 817-825. DOI:10.1016/j.scitotenv.2016.08.150 |
| [200] |
Thompson JN. Coevolution: the geographic mosaic of coevolutionary arms races. Current Biology, 2005, 15(24): R992-R994. DOI:10.1016/j.cub.2005.11.046 |
| [201] |
Barner AK, Coblentz KE, Hacker SD et al. Fundamental contradictions among observational and experimental estimates of non-trophic species interactions. Ecology, 2018, 99(3): 557-566. DOI:10.1002/ecy.2133 |
| [202] |
de Menezes AB, Prendergast-Miller MT, Richardson AE et al. Network analysis reveals that bacteria and fungi form modules that correlate independently with soil parameters. Environmental Microbiology, 2015, 17(8): 2677-2689. DOI:10.1111/1462-2920.12559 |
| [203] |
Lindström ES, Langenheder S. Local and regional factors influencing bacterial community assembly. Environmental Microbiology Reports, 2012, 4(1): 1-9. DOI:10.1111/j.1758-2229.2011.00257.x |
| [204] |
Toju H, Kishida O, Katayama N et al. Networks depicting the fine-scale co-occurrences of fungi in soil horizons. PLoS One, 2016, 11(11): e0165987. DOI:10.1371/journal.pone.0165987 |
| [205] |
Yang J, Pei HG, Lv JP et al. Seasonal co-occurrence patterns of bacterial and eukaryotic phytoplankton communities and ecological effects of keystone taxa in an urban river. Authorea, 2020, 29. DOI:10.22541/au.159602488.89942318 |
| [206] |
Jordán F, Pereira J, Ortiz M. Mesoscale network properties in ecological system models. Current Opinion in Systems Biology, 2019, 13: 122-128. DOI:10.1016/j.coisb.2018.12.004 |
| [207] |
Banerjee S, Schlaeppi K, van der Heijden MGA. Keystone taxa as drivers of microbiome structure and functioning. Nature Reviews Microbiology, 2018, 16(9): 567-576. DOI:10.1038/s41579-018-0024-1 |
| [208] |
Allesina S, Bodini A, Pascual M. Functional links and robustness in food webs. Philosophical Transactions of the Royal Society B: Biological Sciences, 2009, 364(1524): 1701-1709. DOI:10.1098/rstb.2008.0214 |
| [209] |
Pozsgai G, Baird J, Littlewood NA et al. Interspecific networks in ground beetle (Coleoptera: Carabidae) assemblages. Ecological Indicators, 2016, 68: 134-141. DOI:10.1016/j.ecolind.2015.11.031 |
| [210] |
Sridhar H, Jordán F, Shanker K. Species importance in a heterospecific foraging association network. Oikos, 2013, 122(9): 1325-1334. DOI:10.1111/j.1600-0706.2013.00101.x |
| [211] |
Leese F, Bouchez A, Abarenkov K et al. Why we need sustainable networks bridging countries, disciplines, cultures and generations for aquatic biomonitoring 2.0: A perspective derived from the DNAqua-net COST action. Advances in Ecological Research, 2018, 58: 63-99. DOI:10.1016/bs.aecr.2018.01.001 |
| [212] |
Deiner K, Bik HM, Mächler E et al. Environmental DNA metabarcoding: Transforming how we survey animal and plant communities. Molecular Ecology, 2017, 26(21): 5872-5895. DOI:10.1111/mec.14350 |
| [213] |
Zhang WW, Xie YW, Yang JH et al. Applications and prospects of metabarcoding in environmental monitoring of phytoplankton community. Asian Journal of Ecotoxicology, 2017, 12(1): 15-24. [张宛宛, 谢玉为, 杨江华等. DNA宏条形码(metabarcoding)技术在浮游植物群落监测研究中的应用. 生态毒理学报, 2017, 12(1): 15-24. DOI:10.7524/AJE.1673-5897.20160729002] |
| [214] |
Wang JQ, Wang SP, Zhang Y et al. Community structure characteristics of eukaryotic planktonic algae in Liaohe River through high-throughput sequencing. Environmental Science, 2017, 38(4): 1403-1413. [王靖淇, 王书平, 张远等. 高通量测序技术研究辽河真核浮游藻类的群落结构特征. 环境科学, 2017, 38(4): 1403-1413. DOI:10.13227/j.hjkx.201609133] |
| [215] |
Civade R, Dejean T, Valentini A et al. Spatial representativeness of environmental DNA metabarcoding signal for fish biodiversity assessment in a natural freshwater system. PLoS One, 2016, 11(6): e0157366. DOI:10.1371/journal.pone.0157366 |
| [216] |
Shaw JLA, Clarke LJ, Wedderburn SD et al. Comparison of environmental DNA metabarcoding and conventional fish survey methods in a river system. Biological Conservation, 2016, 197: 131-138. DOI:10.1016/j.biocon.2016.03.010 |
| [217] |
Li JL, Hatton-Ellis TW, Lawson HLJ et al. Ground-truthing of a fish-based environmental DNA metabarcoding method for assessing the quality of lakes. Journal of Applied Ecology, 2019, 56(5): 1232-1244. DOI:10.1111/1365-2664.13352 |
| [218] |
Evans NT, Olds BP, Renshaw MA et al. Quantification of mesocosm fish and amphibian species diversity via environmental DNA metabarcoding. Molecular Ecology Resources, 2016, 16(1): 29-41. DOI:10.1111/1755-0998.12433 |
| [219] |
Cannon MV, Hester J, Shalkhauser A et al. In silico assessment of primers for eDNA studies using PrimerTree and application to characterize the biodiversity surrounding the Cuyahoga River. Scientific Reports, 2016, 6(1): 22908. DOI:10.1038/srep22908(2016) |
| [220] |
Lacoursière-Roussel A, Rosabal M, Bernatchez L. Estimating fish abundance and biomass from eDNA concentrations: Variability among capture methods and environmental conditions. Molecular Ecology Resources, 2016, 16(6): 1401-1414. DOI:10.1111/1755-0998.12522 |
| [221] |
Bista I, Carvalho GR, Walsh Kerry et al. Annual time-series analysis of aqueous eDNA reveals ecologically relevant dynamics of lake ecosystem biodiversity. Nature Communications, 2017, 8(1): 14087. DOI:10.1038/ncomms14087 |
| [222] |
Coble AA, Flinders CA, Homyack JA et al. eDNA as a tool for identifying freshwater species in sustainable forestry: A critical review and potential future applications. Science of the Total Environment, 2019, 649: 1157-1170. DOI:10.1016/j.scitotenv.2018.08.370 |
| [223] |
Han BP, Li QH, Xu YP et al. Origin and development of gradient analysis for biological communities and the generalized dissimilarity modelling with its application. Journal of Guizhou Normal University: Natural Sciences, 2022, 40(2): 1-10. [韩博平, 李秋华, 徐玉萍等. 生物群落梯度分析方法的由来、发展及广义非相似性模拟方法与应用. 贵州师范大学学报: 自然科学版, 2022, 40(2): 1-10.] |
| [224] |
Cordier T, Alonso-Sáez L, Apothéloz-Perret-Gentil L et al. Ecosystems monitoring powered by environmental genomics: A review of current strategies with an implementation roadmap. Molecular Ecology, 2021, 30(13): 2937-2958. DOI:10.1111/mec.15472 |