(2: 玉溪师范学院地理与国土工程学院, 玉溪 653100)
(2: College of Geography and Land Engineering, Yuxi Normal University, Yuxi 653100, P. R. China)
随着流域人口和土地开发强度的持续增加,大量营养物质进入内陆水体导致了湖泊水体的富营养化并出现生物群落的快速演替、生物多样性的持续降低,进而威胁了湖泊生态系统的功能和健康[1]。在污染湖泊的环境治理中,建立水环境指标的自然背景值和修复目标是开展湖泊生态修复的重要前提和科学基础。由于大部分湖泊的水质监测时间较短、采样频率较低且数据连续性不高,湖泊监测数据通常无法为湖泊修复提供可靠的环境背景条件和恢复目标值[2]。近30年来,古湖沼学方法的应用和定量模型的发展为湖泊环境修复目标的建立提供了重要的技术手段[2-3]。如在欧盟发布的《水框架指南》中,古湖沼学方法已成为评价湖泊生态健康的重要手段之一,为欧洲湖泊的环境变化历史识别并建立环境修复目标值提供了重要的基础数据[4]。
古湖沼学方法的应用主要通过沉积物的环境代用指标来提取湖泊环境变化和生态响应的时间序列[5]。同时,通过建立湖泊现代生物群落和水环境因子的定量关系,可将其应用于生物群落演替的沉积物序列来开展环境因子的定量重建[6]。目前,古湖沼学分析已经成为国内开展湖泊富营养化历史和古生态研究的重要手段,且以沉积物总磷(TP)、总氮(TN)和色素(如叶绿素a(Chl.a))等环境代用指标为主[7]。由于营养元素和藻类色素在沉降和埋藏过程中存在迁移、转化、分解、再悬浮等理化过程和成岩作用,沉积物的环境代用指标对湖泊营养水平的指示意义通常具有较大的不确定性[5]。因此,建立并应用湖泊现代生物与水环境梯度的定量模型(如转换函数)已成为国内外开展营养水平定量重建的重要手段[7]。
湖沼学大量调查表明,湖泊生物的群落构建及其区域分布特征与水环境梯度的关系显著[6]。由于藻类等光合生物对湖泊环境的物种响应特征较为稳定,建立的湖泊生物-环境定量关系能充分模拟生物群落在关键环境梯度上的分布模式,可用于定量重建水体环境变化的长期历史[8]。湖泊水体和表层沉积物的区域调查显示,较长的环境梯度(如TP)对水生生物的群落构建具有重要的驱动作用[9],且大量物种在该梯度上通常呈现出单峰响应的生态模式[8, 10]。硅藻作为湖泊初级生产者的重要组成,其个体小、生命周期短,能快速地响应水体水质和湖泊环境的变化[11]。湖泊调查显示,不同硅藻物种的生长通常具有稳定的水体TP最适宜值,从而出现硅藻群落在营养盐梯度上的物种转换和群落演替。如随着水体TP浓度的增加,硅藻群落的优势物种出现由清水种(如Cyclotella radiosa、Fragilaria spp.)向耐污种(如Fragilaria crotonensis、Cyclotella ocellata)演替的显著特征[12]。1990s以来,基于硅藻群落建立的TP转换函数已在全球范围内各个地区被广泛应用,如欧洲[13-14]、北美[15]。同时,在长江中下游地区[16-17]和松嫩平原[18]等国内多个地区也建立了硅藻-总磷的转换函数,并被用于湖泊水体TP的定量重建和背景值识别[7]。然而在气候变化和人类活动影响下部分湖泊可能会经历多个环境压力的胁迫影响,生物群落演替存在受不同环境因子驱动的响应模式和阶段性特征[19]。因此,围绕模型预测结果需要结合零模型检验、现代监测数据等开展重建环境因子的显著性分析和预测值的可靠性验证。
近几十年来随着云南地区流域开发的增强,大量湖泊经历了不同程度的富营养化过程并产生了严重的生态环境问题。云南湖泊的现代监测时间较短(如< 20年)且主要集中在九大高原湖泊,而该地区的古湖沼学调查主要基于TN、TP、色素等环境代用指标进行近百年来的趋势分析。已有调查结果显示,1950s以来云南地区的部分湖泊已经出现了水体的富营养化和藻类数量的增加[20-23]。沉积物硅藻分析显示,随着富营养化的持续,云南湖泊的硅藻群落均出现了从寡营养物种向耐营养种的演替模式[24-26]。如随着水体营养水平的上升,星云湖硅藻群落中贫营养的Cyclotella rhomboideo-elliptica逐步消失而耐营养种Cyclostephanos dubius的丰度显著增加[27-28]。目前,国内在长江中下游和松嫩平原地区建立的硅藻-TP转换函数已分别被用于定量重建了太白湖[29]和查干湖[30]的TP变化历史。由于不同的生物区系中物种的环境适宜值与功能性状受环境背景、演化历史等影响可能存在差异,建立特定生物区系内湖泊生物与水环境的转换函数是开展该地区湖泊环境定量重建的重要前提[31]。因此开展云南湖泊的硅藻-TP转换函数分析,可为重建低纬高原地区水体富营养化的定量历史提供有效的分析手段。
本文以云南地区45个湖泊(水体TP梯度为2~765 μg/L)为调查对象,通过调查湖泊水质并开展表层沉积物硅藻的群落分析,结合多变量统计分析首先建立了云南湖泊的硅藻-TP转换函数。进一步应用该模型对星云湖近百年来的水体TP值进行了定量重建,并通过零模型检验及与现代监测数据的对比分析对TP重建结果进行了可靠性评价。本研究建立的硅藻-总磷转换函数可为云南污染湖泊的水体营养水平本底值和修复目标识别提供重要的技术手段和科学依据。
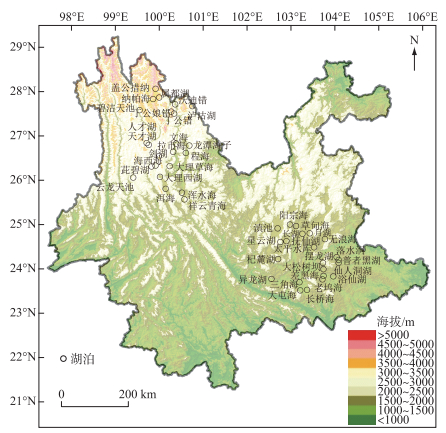
1 材料与方法 1.1 区域概况云南位于中国西南地区,是云贵高原的重要组成部分。地势起伏明显,地貌以高原和山地为主,海拔从东南向西北逐渐增加(图 1),海拔高差达6673 m。以亚热带季风气候为主,气温日较差大、年较差小,年平均降水量1000 mm左右,干湿季分明(雨季: 5—9月,干季: 10月—次年4月)。
|
图 1 云南45个湖泊的地理位置与海拔分布 Fig.1 Location and altitude of 45 study lakes in Yunnan |
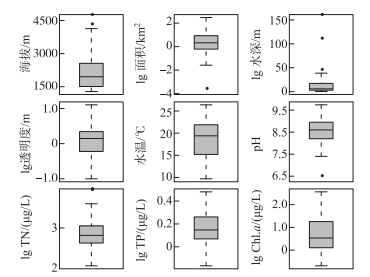
在2011—2019年夏季,先后对云南地区的45个湖泊开展了湖泊水质和表层沉积物调查(图 1)。湖泊调查覆盖区域的纬度跨度约4.6°,海拔高差超过2900 m,其中滇东南地区三角海的海拔最低(1285 m a.s.l.)、盖公措纳海拔最高(4214 m a.s.l.)。受海拔梯度等影响,湖泊水体的夏季温度差超过10℃。湖沼学特征表明(图 2),45个湖泊的湖盆形态和水质差异明显。湖泊面积数据显示,滇池水域面积接近300 km2,浴仙湖面积最小(< 0.01 km2)。湖泊水深梯度长,抚仙湖的水深达155 m,而浴仙湖的水深仅0.3 m。45个湖泊的TP梯度范围为2~765 μg/L(图 2),覆盖了云南地区从贫营养水平到重富营养水平的代表性湖泊。基于Carlson湖泊营养状态指数(TSI)[32]的水体营养水平分类显示,贫营养水平(3个)、贫-中营养水平(9个)、中营养水平(14个)、轻度富营养水平(7个)、中度富营养水平(6个)和重度富营养化(6个)的湖泊均有分布。
|
图 2 云南45个湖泊的主要湖沼学参数分布特征 Fig.2 Boxplots showing the distribution of key limnological parameters of 45 study lakes in Yunnan |
为了反映湖泊整体水质状态,在湖泊最深处用手持便携式测深仪测量了采样点水深,用塞氏盘测定了湖泊透明度,使用多参数水质分析仪(美国Xylem公司,型号YSI6600V2)测试了水体温度、pH等重要参数。在每个湖盆的最深处采集水质和表层沉积物样品,采用分光光度法分析了水体的TP、TN、Chl.a等指标[33]。
本研究采用国际通用方法开展硅藻分析[34]。主要步骤包括:每个样品称取0.5 g左右放入烧杯中,加入10%的盐酸去除碳酸盐,再添加适量过氧化氢去除样品中的有机质,80℃水浴4 h后用离心机清洗样品即可。将溶液滴在盖玻片上自然风干后用Naphrax胶固定玻片再进行鉴定。物种鉴定主要参照Krammer和Lange-Bertalot[35]的硅藻分类系统,每个样品鉴定400个左右壳体,在Leica(DM2500)相差显微镜1000倍油镜下完成。云南本地种的鉴定主要参照文献[36]等。
1.3 数据分析方法为识别湖泊水体环境的主要梯度及其对硅藻群落分布的驱动强度,对环境变量与硅藻数据进行了限制性排序分析。首先选取45个湖泊中出现在2个及以上湖泊中且至少在1个湖泊中丰度>1%的硅藻物种进行DCA分析,根据DCA主轴1的长度判断硅藻群落的响应模式(即DCA主轴1长度>2 SD,单峰为主; DCA主轴1长度≤ 2 SD,线性为主)[37]。由于本研究中DCA主轴1的长度为3.9 SD,因此环境对硅藻群落的限制性分析方法采用的是CCA分析。分析前将物种数据进行平方根转换,环境数据(除pH)经过正态分布检验(Q-Q图)后进行数据转换。然后通过独立CCA的方法计算每个环境变量的边界效应,具有独立效应(Monte-Carlo检验)且膨胀系数小于20的环境变量作为显著变量用于CCA分析。独立CCA分析结果显示具有独立性,且在主轴1和主轴2上的特征根(λ)比值大于0.5的环境变量,用于进一步建立硅藻-环境转换函数[38]。
根据物种对环境变量的响应模式,本文采用了非线性模型建立转换函数。首先,将独立CCA中识别出的环境因子与硅藻数据进行降趋典型对应分析(DCCA),根据环境变量在DCCA主轴1上的长度判断数据库适合用线性或非线性模型建立转换函数。当梯度长度>2 SD时,数据库适合采用非线性的加权平均(weighted average,WA)和偏最小二乘加权平均回归(weighted averaging partial least squares,WA-PLS)的方法建立转换函数[8, 39]。由于数据的处理方式可能会对模型结果产生影响[14],本文同时采用原始和平方根转换后的物种丰度数据建立转换函数,选择预测能力更强的模型用于星云湖水体TP的重建。转换函数中的TP数据已经过正态分布检验后进行了对数转换,并通过留一法(leave-one-out,LOO)对模型进行交叉检验[39]。模型推导能力主要通过检验后的推导误差(root mean squared error of prediction,RMSEP)和观测值以及推导值之间的回归系数(R2)来判断[19],即推导误差值最小、相关系数最大的模型最优。
结合星云湖钻孔已发表的年代序列和硅藻群落演替数据[28],进一步应用建立的转换函数对近百年来营养水平的变化历史进行定量重建。首先结合现代监测数据对重建的TP数值进行相关分析,用于判断模型重建结果的可靠性水平。然后利用零模型对重建的TP结果进行显著性检验[19],用于识别判断TP梯度对群落演替产生驱动作用的显著性水平。零模型的建立通过随机抽样方法建立99个转换函数并将其用于重建星云湖水体TP值,该零模型方法定量重建的TP值所具有的独立解释方差形成了开展显著性水平检验的频率分布图。如果重建的星云湖TP对硅藻群落的驱动强度大于零模型方法中95%置信水平的重建结果,且与PCA主轴1解释方差相近,则表明近百年来硅藻群落的演替受TP梯度的影响显著。
本研究的排序分析主要在R语言(4.0.2版本)的vegan(2.5-6版本)程序包中完成[40-41],转换函数的建立及检验在C2(1.7.2版本)中完成[42]。星云湖水体TP重建分析在rioja(0.9-26版本)程序包中完成[43],重建结果的零模型检验在palaeoSig(2.0-3版本)程序包中完成[44]。
2 研究结果 2.1 云南湖泊硅藻的分布特征与主要环境梯度识别云南地区45个湖泊的表层沉积物中,共鉴定出硅藻属种301个。其中,出现在两个及以上湖泊中且至少在一个湖泊中相对丰度>1%的硅藻种共112个,出现在10个以上湖泊中的物种有33个且以附生类型的硅藻种为主(附生种21个,浮游种12个)。常见的附生种以Achnanthes、Navicula、Fragilaria、Nitzschia 4个属的物种为主,而浮游种以Fragilaria crotonensis、F. ulna、Aulacoseira ambigua、A. granulata、Cyclostephanos dubius、Stephanodiscus hantzschii和Cyclotella种属为主。
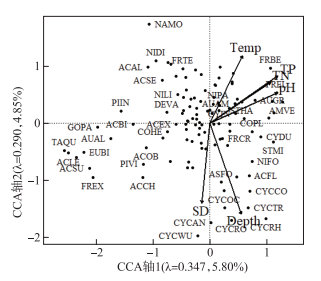
结合45个湖泊的现代水环境变量,对硅藻群落数据进行独立CCA分析和Monte-Carlo检验,可识别出环境变量的独立解释能力和显著性水平。进一步将具有独立效应的环境变量组合进行VIF检验,识别变量之间的共线性。结果显示(表 1),水体pH、TP、TN、水温、透明度和水深对云南硅藻群落的空间分布具有显著的独立效应(P < 0.05),且膨胀系数均小于5。CCA主轴1正半轴以耐营养物种为主(如Cocconeis placentula、Amphora veneta、Cyclostephanos dubius和C. invistatus),负半轴物种以附生寡营养物种为主(如Achnanthes、Navicula属的物种为主;图 3)。独立CCA分析和Monte-Carlo检验的结果显示,水体TP水平是影响云南湖泊硅藻群落空间变化的主要环境变量,独立解释了云南湖泊硅藻群落空间分布变化的4.54% (P < 0.001)。独立CCA分析中,TP在主轴1和主轴2上的特征根值分别为0.272和0.472,特征根之比为0.576,大于可以用于建立转换函数的临界值0.5[38]。因此,TP是驱动硅藻群落空间分布的关键因子,可进一步开展硅藻-TP转换函数的构建分析。
| 表 1 独立CCA分析中6个显著环境变量的膨胀因子(VIF)、特征根值、解释方差及其显著性检验结果 Tab. 1 Summary of partial CCA analyses showing VIF, eigenvalue, explained variance and significance level for each of the six significant environmental variables |
|
图 3 云南45个湖泊硅藻群落与显著环境指标空间分布的CCA分析三标图 (环境变量分别为:水体酸碱度(pH)、总磷(TP)、总氮(TN)、水温(Temp)、透明度(SD)、水深(Depth)。出现在两个及以上湖泊中且至少在一个湖泊中丰度>1%的物种被用于此分析,部分物种代码被标注,物种代码及属种名(按代码字母顺序排列):ACAL-Achnanthes altica,ACBI-Achnanthes bioretii, ACCH-Achnanthes chlidanos, ACEX-Achnanthes exigua, ACFL-Achnanthes flexella, ACLE-Achnanthes levanderi, ACSE-Achnanthes semiaperta, ACSU-Achnanthes subatomoides, ACOB-Achnanthes oblongella, AMVE-Amphora veneta, ASFO-Asterionella formosa, AUAL-Aulacoseira alpigena, AUAM-Aulacoseira ambigua, AUGR-Aulacoseira granulata, AUSU-Aulacoseira subarctica, COPL-Cocconeis placentula, CYCAN-Cyclotella antiqua, CYCCO-Cyclotella comensis, CYCOC-Cyclotella ocellata, CYCRH-Cyclotella rhomboideo-elliptica, CYCRO-Cyclotella rossii, CYCTR-Cyclotella tripartica, CYCWU-Cyclotella wuethrichiana, CYDU-Cyclostepanos dubius, CYIN-Cyclostepanos invistatus, DEVA-Denticula valida, EUBI-Eunotia bilunaris, FRBE-Fragilaria berolinensis, FRCR-Fragilaria crotonensis, FREL-Fragilaria elliptica, FREX-Fragilaria exigua, FRTE-Fragilaria tenera, GOHE-Gomphonema hebridense, GOPA-Gomphonema parvulum, NAMO-Navicula molestiformis, NIFO-Nitzschia fonticola, NIDI-Nitzschia dissipata, NIGR-Nitzschia gracilis, NILI-Nitzschia linearis, NIPA-Nitzschia palea, PIIN-Pinnularia interrupta, PIVI-Pinnularia viridis, RHGI-Rhopalodia gibba, STHA-Stephanodiscus hantzschii, STMI-Stephanodiscus minutulus, TAQU-Tabellaria quadriseptata) Fig.3 Triplot of the CCA analysis showing the spatial distribution of diatom assemblages and significant environmental factors for 45 study lakes in Yunnan |
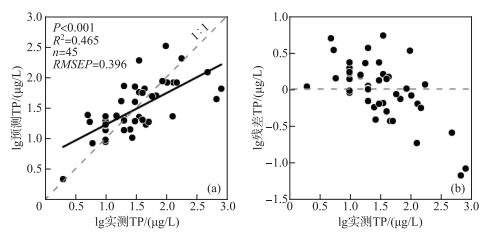
将TP作为唯一的限制性环境因子,对硅藻数据进行了DCCA分析用于统计模型的选择[45]。结果显示DCCA主轴1的长度为2.16 SD,大于单峰响应的临界值,因此可利用非线性模型(WA和WA-PLS)建立转换函数。结合百分比和平方根转换的两类硅藻数据应用WA和WA-PLS两种模型方法,建立了多个云南45个湖泊的硅藻-TP转换函数(表 2)。经比较发现,平方根转换后的硅藻数据与TP建立的转换函数模型中WA-PLS组分2是最佳模型,其相关系数(R_jack2=0.465)最大,推导误差(RMSEP=0.396)最小(表 2)。同时水体TP的实测值与该模型预测值之间具有显著的相关性(P < 0.001,R2=0.65,n = 45;图 4a),且大部分样点的残差分布在±0.5范围内(图 4b)。
| 表 2 基于云南45个湖泊的硅藻-TP转换函数模型及关键参数结果 Tab. 2 Summary on key parameters of diatom-TP transfer function models for 45 study lakes in Yunnan |
|
图 4 云南45个湖泊表层沉积物硅藻-水体TP转换函数的最优模型及其预测能力评价 Fig.4 Evaluation of model performances for the optimal transfer function based on surface sediment diatoms on inferred lake-water TP of 45 study lakes in Yunnan |
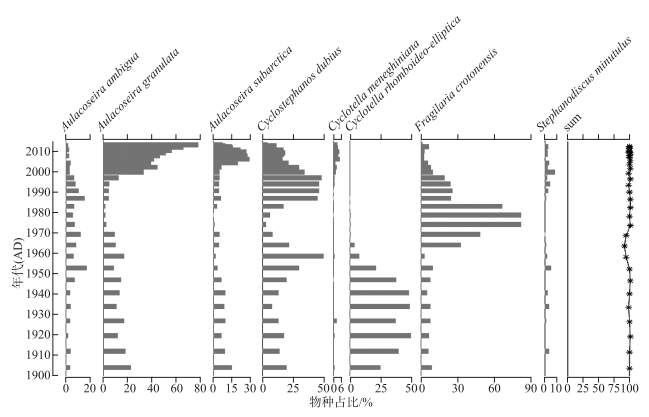
已有钻孔分析表明,近百年来星云湖的硅藻群落变化主要是由湖泊营养水平上升导致的[28]。因此可以利用其硅藻群落数据开展水体TP值的定量重建,并进行模型重建的可靠性评价[19]。近百年来星云湖硅藻群落主要由A. ambigua、A. granulata、A. subarctica、C. dubius、Cyclotella meneghiniana、C. rhomboideo-elliptica、F. crotonensis、Stephanodiscus minutulus等浮游种组成,群落的绝对优势种出现了从贫营养物种(C. rhomboideo-elliptica)向中营养种(F. crotonensis)和富营养种(A. granulata)的转变(图 5)。1950s前,群落中C. rhomboideo-elliptica占绝对优势,且该种已经被证实为贫营养物种[36];1950s-1980s期间,喜中营养的F. crotonensis相对丰度明显增加,与流域开发导致水体营养水平的上升有关;1980s末以来,随着湖泊营养水平的加速上升和湖泊水动力的增强,硅藻群落以A. granulata、A. subarctica、C. dubius 3个浮游种为主,且沉降速率高、耐营养的物种A. granulata成为绝对优势种(图 5)。
|
图 5 近百年来星云湖硅藻群落变化的地层图(相对丰度>5%的属种)(sum值反映了用于重建星云湖近百年来水体TP的硅藻属种在每个样品中的总百分比;年代序列和硅藻群落演替数据来源于文献[28]) Fig.5 Stratigraphic map of diatom community changes in Lake Xingyun in the past 100 years (species with relative abundance>5% are shown) (the sum value shows the total percentage of the diatom taxa that are included in the transfer function for each sample. Chronological sequence and diatom data were collated from literature [28]) |
基于WA-PLS组分2的转换函数最优模型,利用星云湖硅藻群落数据对星云湖近百年来的水体TP值进行了重建,并结合1988—2015年期间的现代监测数据[46-47]对重建结果进行了可靠性评价。定量重建结果显示,20世纪前半叶TP的浓度范围在12.8~29.3 μg/L之间,1950s末TP总磷浓度略有升高(45.4 μg/L),1980s末TP浓度开始持续升高。结合监测数据的对比分析表明,1980s以来水体TP值的重建结果与实测数据变化趋势总体一致(图 6a),重建结果与实测TP浓度之间存在显著相关(P < 0.001,R2=0.79,n=13;图 6b),且1980s以前星云湖水体TP浓度不超过50 μg/L。零模型检验结果显示,重建的TP梯度对硅藻群落长期变化的影响显著(P=0.01),驱动了星云湖沉积物硅藻群落变化的44% (P=0.01,R2=0.44;图 6c),高于零模型中置信水平为95%的解释方差(39.3%),同时与硅藻群落PCA主轴1的解释方差(48.5%)相近。

|
图 6 近百年来星云湖水体TP浓度重建与实测数据(a)和检验结果对比分析(b、c)(图b是1988—2015年期间的监测数据[46-47]与重建数据的散点图;图c是用随机抽样建立的99个转换函数重建的星云湖水体TP解释硅藻群落变化方差的频率直方图。其中左侧虚线表示95%置信水平下99个随机转换函数重建TP解释硅藻群落变化的方差;实线是本文最优模型的重建TP值对硅藻群落演替的解释方差;右侧虚线是近百年来星云湖硅藻群落PCA主轴1的解释方差) Fig.6 Plots showing the time series of reconstructed and monitored TP values in the past 100 years (a) and summary of model performances on TP reconstruction (b, c) in Lake Xingyun, respectively (Plot b is a scatter plot showing the relationship between monitored TP[46-47] and reconstructed TP data during 1988-2015. Plot c is the histogram showing frequency distribution of diatom variances explained by TP reconstructed with 99 established transfer functions through random sampling. The left dotted line represents the variance of diatom assemblages explained by TP data reconstructed from randomly constructed transfer functions at the confidence level of 95%. The black solid line indicates the variance of diatom data explained by TP inferred by the optimal transfer function established in this paper. The right dotted line shows the variance explained by PCA axis 1 of diatom assemblages over the last century) |
对云南45个湖泊的水体水质和表层沉积物硅藻等调查发现,超过70%的湖泊处于中营养及以上营养水平,且水体TP梯度(2~765 μg/L)是影响湖泊硅藻空间分布的主要环境因子。对硅藻数据和TP梯度建立的转换函数中,交叉检验结果显示硅藻和TP数据分别经过平方根和对数转换后建立的模型(即WA-PLS组分2)具有最强的预测能力。结合星云湖的硅藻群落演替序列,应用该最优模型对近百年来的水体TP进行定量重建,并结合近30年的监测数据和零模型检验等方法对重建结果进行了交叉验证,表明该转换函数在云南地区典型富营养化湖泊中的TP重建结果具有较高的可靠性。
3.1 水体TP梯度下云南湖泊硅藻的空间分布特征及指示物种识别人类活动产生的氮、磷等营养物质增加导致了水体营养水平的快速上升,湖泊富营养化进程的加快可以显著改变湖泊生物群落的物种组成和空间分布。特别是随着磷肥和含磷洗涤剂的使用,大量的磷进入湖泊水体中,提高了湖泊生态系统的初级生产力并改变了生物群落的结构[1]。硅藻是湖泊藻类的重要组成,对水体营养水平十分敏感,随着湖泊的富营养化硅藻优势物种常出现从寡营养种向耐污种的演替[12]。云南湖泊的TP浓度分布范围较广,从贫营养到超富营养水平的湖泊类型均有分布。CCA分析与独立性、显著性检验等结果显示,TP是影响硅藻群落空间分布的重要环境因子。如在CCA分析中(图 3),主轴1正方向上出现的物种TP最优值均较高(表 3),以耐营养物种(如A. granulata、C. dubius)为主,而负方向上的Tabellaria、Achnanthes等属种的TP最优值较低。
| 表 3 云南和长江中下游地区湖泊常见硅藻属种的TP最优值和耐受范围对比* Tab. 3 Comparison of TP optimal values and tolerance ranges of common diatom species in lakes from Yunnan and the middle and lower reaches of the Yangtze River |
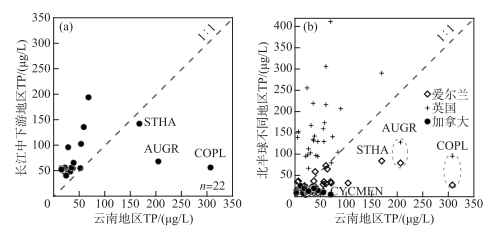
水体富营养化梯度下,云南湖泊具有与其他生态区相似的物种演替序列,但同一物种在营养盐最适值上呈现出区域差异。如基于TP最优值和耐受范围计算,指示云南湖泊富营养化的硅藻物种与长江中下游地区不完全一致,且云南湖泊硅藻属种的TP最优值整体低于长江中下游地区(表 3)。在云南地区,TP最优值(含耐受范围)超过100 μg/L的硅藻主要有A. granulata、Cocconeis placentula和S. hantzschii,这些物种指示了云南湖泊的富营养化;而在长江中下游地区,C. meneghiniana、C. atomus、Stephanodiscus parvus、S. minutulus、Navicula subminiscula是湖泊富营养化发生的指示性属种[48],与云南湖泊富营养化的指示性属种不一致。在云南地区指示潜在富营养化的物种主要是TP最优值及耐受范围超过50 μg/L的硅藻属种,包括C. dubius、C. meneghiniana、C. pseudostelligera和Nitzschia palea;然而长江中下游的潜在富营养化指示性物种则是Aulacoseira alpigena、C. dubius、C. tholiformis、C. invisitatus、S. hantzschii、Navicula cirtrus、Nitzschia agnita、N. subacicularis等物种。由此可见,云南和长江中下游地区湖泊中共同指示湖泊存在潜在富营养化水平的属种为C. dubius等。围绕云南和长江中下游地区出现在10个及以上湖泊中的常见硅藻22个属种,除了A. granulata、C. placentula和S. hantzschii以外,云南湖泊中硅藻属种的TP最优值总体低于长江中下游(表 3,图 7a)。
|
图 7 北半球不同地区湖泊中常见硅藻属种TP最优值的对比分析(图a共选取了同时出现在云南和长江中下游地区10个以上湖泊中且最大丰度大于1%的属种,共22个,将属种TP最优值制成的散点图,物种清单如表 3。图b是选取欧美地区与中国云南地区相似或相同硅藻属种的TP最优值数据制成的散点图。数据分别来源于:中国长江中下游地区(湖泊数量n=49)[17]、加拿大(n=42)[15]、英国(n=123)[13]、爱尔兰(n=72)[14]。物种代码及属种名:STHA-Stephanodiscus hantzschii、AUGR-Aulaocoseira granulata、COPL-Cocconeis placentula、CYCMEN-Cyclotella meneghiniana) Fig.7 Comparison of optimal values of TP for common diatom species in different regions of north hemisphere (In plot a, a total of 22 species with a maximum abundance greater than 1% are shown from more than 10 lakes in Yunnan and the middle and lower reaches of the Yangtze River. The scatter diagram is made from the optimal value of TP of species. The list of species is shown in Tab. 3. In plot B, the scatter plot shows the comparison of TP optimal value data of diatom species in Europe, North America and Yunnan of China, respectively. The data are from the middle and lower reaches of the Yangtze River in China (number of lakes, n=49)[17], Canada (n=42)[15], Britain (n=123)[13], Ireland (n=72)[14], respectively. Codes and species names shown include: STHA-Stephanodiscus hantzschii, AUGR-Aulaocoseira granulata, COPL-Cocconeis placentula, and CYCMEN-Cyclotella meneghiniana) |
湖泊硅藻属种的TP最优值存在区域差异,可能与不同研究区的TP梯度特征相关。由于属种的环境最优值用加权平均的方法计算,该方法假定物种在环境梯度上呈高斯分布,其生态最优值即物种最大相对丰度所对应的环境指标值[49],因此属种TP最优值结果受TP梯度的分布特征影响较大。不同地区的流域开发历史和强度不同,导致了湖泊富营养化历史和营养水平梯度的差别,进而导致同一属种在TP最优值上具有区域差异。如长江中下游地区的流域开发历史悠久,湖泊营养水平总体偏高;而云南湖泊的营养水平从贫营养到富营养分布均匀,导致了云南地区湖泊的硅藻属种TP最优值低于长江中下游地区(表 3,图 7a)。与北半球其他地区(如英国、爱尔兰、加拿大)相比,中国云南地区的相似或相同属种的TP最优值低于英国地区但整体高于加拿大、爱尔兰等地区硅藻属种TP最优值(图 7b)。英国湖泊流域开发强度大且以富营养化水平为主,而加拿大和爱尔兰湖泊的营养水平较低,可能导致了硅藻TP最优值的差异大。Bennion选取了英格兰东南部的富营养浅水湖泊进行物种计算,31个样点中以TP浓度大于100 μg/L的20个湖泊为主[13],导致了该地区计算出的硅藻属种TP最优值较高。加拿大魁北克地区42个湖泊中仅1个湖泊的TP浓度达到52 μg/L,其他湖泊均小于50 μg/L[15],因此魁北克地区的湖泊硅藻TP最优值都明显低于云南地区。类似地,爱尔兰地区的72个湖泊中仅12个湖泊的TP浓度高于50 μg/L,且其中仅2个湖泊的TP浓度高于100 μg/L(分别为141和142.3 μg/L)[14]。
在指示营养水平的硅藻物种中,部分种属还会受其他湖泊环境因子的影响而出现较大的耐受范围。对中国云南、长江中下游地区及北半球其他地区的对比分析表明,部分优势物种对湖泊富营养化的指示意义存在较大的区域差异。如浮游物种C. meneghiniana在长江中下游地区和云南地区均为湖泊富营养化的指示物种,在北半球温带地区的大部分湖泊中其TP最优值均小于50 μg/L,但在英国湖泊中可在TP高达408.3 μg/L的水体中可成为优势物种。A. granulata等物种在北半球富营养化的湖泊中丰度较高[50-51],常被视为湖泊富营养化的指示种[52-54]。由于A. granulata属于重硅质属种,在云南地区喀斯特湖泊中较高的硅酸盐浓度对此类属种的生长和繁殖不会产生限制作用。星云湖的硅酸盐浓度为3 mg/L左右,持续的水体富营养化导致了硅藻群落中A. granulata的相对丰度可高达77.9%。在云南地区C. placentula在贫营养到超富营养水平的湖泊中均有分布,本次调查中在重富营养水平的祥云青海(TP值为636.7 μg/L)中该物种的丰度最大。由于C. placentula属于附生种,在浅水湖泊中常附生于叶片较宽的水草上[55]且其环境耐受范围广,在富营养化的湖泊中也能成为优势种[56]。因此,硅藻物种对营养水平的指示性上可能受到化学特征、水深等湖泊类型差异的影响而存在区域差异性。
3.2 云南湖泊的硅藻-TP转换函数推导能力评价云南湖泊硅藻-TP转换函数相较于部分欧洲[13]和长江中下游地区[16]的模型推导能力偏低(如RMSEP更高、R2更低),可能反映了湖泊水深等环境梯度的叠加影响。生物群落的构建过程中常受到多个环境变量的共同影响[9],其中湖泊水深作为湖泊形态的重要指标,决定着生境类型及浮游或底栖硅藻在群落中的组成。从图 3可见,在CCA主轴2方向上水深梯度最长,是影响湖泊硅藻空间分布的次要环境梯度。随着湖泊水深的增加,硅藻群落的组成由以附生属种为主向以浮游属种为主的群落转变(图 3)。在CCA主轴2负半轴上以Cyclotella、Stephanodiscus和F. crotonensis等浮游属种为主,而正半轴则以Achnanthes、Navicula、Nitzschia等附生属种为主。在水深梯度的影响下,湖泊硅藻-TP转换函数的推导能力可能会出现下降[57]。本研究中用于建立转换函数的硅藻数据库中,浮游种有27个而附生种有85个属种。已有研究表明,浮游硅藻能更为快速地响应营养水平的变化[58],而附生种对营养水平的波动较为复杂[59]。与浮游种相比,附生种对TP的变化敏感性总体不高[60]。因此,本研究中优势种群的组成特征可能影响了硅藻-TP转换函数的误差范围,但预测值与实测值之间的相关性及模型的预测能力总体较强。
云南地区多样的湖泊类型与异质性的水体环境可能会对硅藻-TP转换函数的推导能力产生影响。相比以浅水富营养湖泊为主的长江中下游地区[16],云南湖泊环境的差异性不仅表现在营养水平,湖泊形态、水质特征等方面的环境异质性也较高。如长江中下游地区以浅水湖泊为主,而云南地区湖泊断陷或高海拔冰川刨蚀形成的湖泊水深较深,深水湖泊(水深>10 m)约占研究湖泊数量的1/3,使得云南湖泊的环境异质性整体高于长江中下游地区。同时云南湖泊水体的pH、TN、水温及透明度等多个环境梯度的差异较为明显,均对硅藻群落的空间分布产生了一定影响(表 1)。一般而言,湖泊营养水平的梯度越长,获得的硅藻属种最优值和耐受范围越准确,可以提高硅藻-TP转换函数的推导能力[61]。云南地区湖泊从贫营养到超富营养湖泊数量分布较为均匀且水体TP梯度较长,可能是云南湖泊硅藻-TP转换函数具有较高推导能力的重要原因。
云南地区部分湖泊由构造作用形成,物种演化历史长(如百万年尺度)和人类活动影响历史悠久(如千年尺度),可能导致了湖泊硅藻物种的演替特征与其他生物地理分布区存在差异。1957年的湖泊调查表明,在云南抚仙湖、阳宗海、杞麓湖、星云湖和滇池中均发现较高数量的土著种C. rhomboideo-elliptica。而随着流域开发持续增强、湖泊营养水平逐渐升高,2000年后该物种在抚仙湖中相对丰度急剧下降,且在其他湖泊中基本消失[36, 62]。抚仙湖钻孔记录显示,在19世纪末C. rhomboideo-elliptica的相对丰度超过90%,20世纪以来随着湖泊营养水平的缓慢升高,C. rhomboideo-elliptica相对丰度呈现持续降低的趋势,特别是1950s以来急剧下降[24]。本研究中,抚仙湖的表层沉积物C. rhomboideo-elliptica的相对丰度仅为1.84%,硅藻群落以F. crotonensis和C. ocellata等更耐营养的物种为主。在本研究的45个湖泊中,该物种仅出现在抚仙湖和程海的表层沉积物中。因此,特有物种数量的持续下降可能影响了其最优值和耐受范围的准确估算,从而降低了转换函数模型的预测能力。
3.3 星云湖近百年来水体TP重建结果及模型可靠性评价大量研究表明,流域开发与人类活动的增强是导致星云湖水体富营养化的主要原因[46]。星云湖近30年的水质监测结果显示,1980s末星云湖的营养水平开始上升,1990s后期湖泊营养水平快速上升,1995年首次出现藻华现象[46, 63]。流域调查表明,流域高污染经济作物种植、畜禽养殖以及磷矿开采及化工产业的发展使星云湖的氮磷等营养物质浓度快速上升[47]。水体TP重建结果显示,1950s以前水体TP的浓度不超过30 μg/L,硅藻群落中以贫营养的C. rhomboideo-elliptica为主。1950s末开始,随着水体TP浓度的上升C. rhomboideo-elliptica的丰度下降,耐营养的C. dubius丰度增加;在1960s-1980s期间,星云湖水体TP的浓度出现小幅度的下降,硅藻群落中C. dubius的丰度未持续增加,中营养物种F. crotonensis的丰度增加并达到峰值。自1980s末以来,随着TP浓度的快速上升,硅藻群落以耐富营养水平的属种(如C. dubius、A. granulata、A. subarctica和S. hantzschii)为主。星云湖监测结果显示,近年来水体TP值有所降低,而重建结果仍然呈现上升的趋势,与监测结果不完全一致,可能与沉积物中A. granulata丰度的持续增加有关。已有结果显示,星云湖沉积物表层样品中A. granulata的增加,可能与极端干旱事件下湖泊水动力等作用的增强显著相关[28]。
满足利用转换函数重建过去环境指标的研究假设是水体TP定量重建结果具有较强可靠性的重要保证。首先,云南湖泊现代硅藻空间分布的环境影响因子与星云湖硅藻群落演替的长期环境压力上均为水体富营养化。在星云湖的富营养化过程之前,群落主要组成物种C. rhomboideo-elliptica属于贫营养物种[36]。随着湖泊营养水体的上升,硅藻群落逐渐转变成以耐营养的A. ambigua、A. granulata、C. dubius、C. meneghiniana、F. crotonensis等物种为主。星云湖近百年来的硅藻群落变化与湖泊营养水平显著相关,与刘园园等[27]的研究结论一致。其次,星云湖近百年来硅藻群落的主要物种均包含在建立转换函数的硅藻数据库中,是重建结果可靠的重要基础[9]。除1960s的一个样点以外,用于TP重建的钻孔其他样品中硅藻物种总百分含量超过95% (图 5),表明了钻孔硅藻物种与现代硅藻数据集中的物种类似,保证了主要物种的代表性与重建TP的可靠性。因此基于本研究建立的云南湖泊硅藻-TP转换函数模型,对星云湖水体TP重建的定量结果与近30年来的现代监测数据[46-47]具有显著的一致性(图 6),表明了近百年来星云湖TP重建的模型适用性与结果可靠性。因此,本文利用沉积物硅藻群落的演替序列定量重建了水体TP浓度和富营养化历史,可为星云湖的富营养化治理提供参考背景值和科学依据。
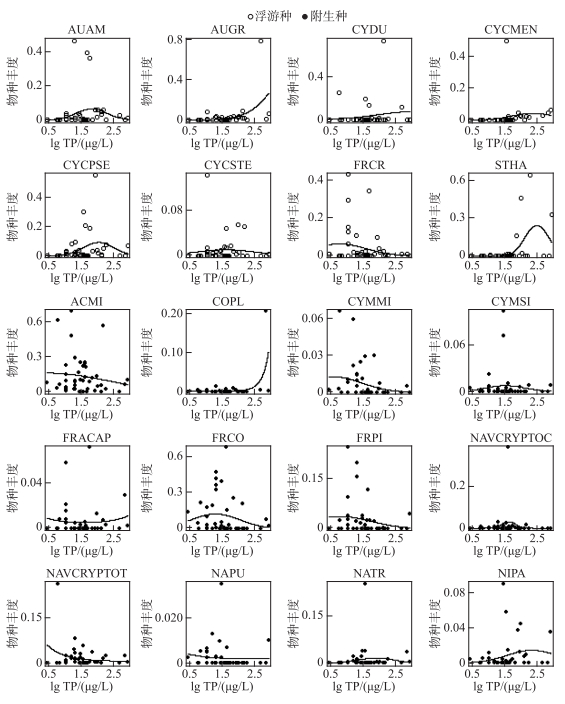
4 结论本研究结合古湖沼学和湖沼学调查方法,对云南45个湖泊的水质和表层沉积物硅藻开展了区域分布调查,利用多元统计分析等方法识别了影响云南湖泊硅藻群落空间分布的主要环境梯度,建立了云南地区的硅藻-TP转换函数,并进一步对星云湖近百年来的水体TP开展定量重建,结合现代监测数据和零模型检验等分析手段评价了重建结果的可靠性与该定量模型的区域适用性。结果显示,流域开发历史和强度的差异导致了云南湖泊水体的营养水平差异大,其中水体TP指示的湖泊营养水平是影响云南湖泊硅藻空间分布的关键环境梯度。物种响应曲线表明,Stephanodiscus hantzschii、Aulacoseira granulata和Cocconeis placentula等硅藻种是指示云南富营养化水体的代表性属种。在建立的硅藻-TP定量模型中,WA-PLS组分2的推导能力最佳。进一步应用该最优模型定量重建了富营养化湖泊(星云湖)的水体TP变化历史,与现代监测数据对比、开展零模型检验等分析手段的应用均表明了该重建结果的可靠性,表明了应用该转换函数可为此类污染湖泊提供可靠的生态修复参考目标。因此,基于硅藻指标开展的水体TP转换函数建立与定量重建的应用可以为我国西南地区的湖泊水环境基准评价提供重要的分析手段。
5 附录附图Ⅰ、Ⅱ见电子版(DOI: 10.18307/2023.0105)。
|
附图Ⅰ 云南45个湖泊中20个常见硅藻物种随湖泊TP梯度变化的物种响应曲线(响应曲线拟合采用高斯逻辑回归方法。图中呈现的物种是在云南和长江中下游地区10个以上湖泊中同时出现的20个属种,分别是:AUAM-Aulacoseira ambigua,AUGR-Aulacoseira granulata,CYDU-Cyclostephanos dubius,CYCME-Cyclotella meneghiniana,CYCPSE-Cyclotella pseudostelligera,CYCSTE-Cyclotella stelligera,FRCR-Fragilaria crotonensis,STHA-Stephanodiscus hantzschii,ACMI-Achnanthes minutissima,COPL-Cocconeis placentula,CYMMI-Cymbella microcephala,CYMSI-Cymbella silesiaca,FRCAP-Fragilaria capucina,FRCO-Fragilaria construens,FRPI-Fragilaria pinnata,NAVCYPTOC-Navicula cryptocephala,NAVCRYPTOT-Navicula cryptotenella,NAPU-Navicula pupula,NATR-Navicula trivialis,NIPA-Nitzschia palea) AttachedFigI Species response curve of common diatom species to TP of 45 lakes in Yunnan (the response curves fitted with Gaussian logistic regression. The taxa shown in the figure are the 20 species that occurred in more than 10 lakes and appeared in both Yunnan and the middle and lower reaches of the Yangtze River regions) |
|
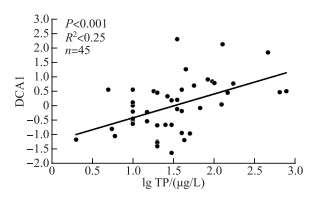
附图Ⅱ 云南45个湖泊硅藻DCA主轴1样点得分与水体TP水平的散点图 AttachedFigII Scatter plot showing the relationship between site scores of DCA axis 1 and lake-water TP of 45 lakes in Yunnan |
| [1] |
Carpenter SR, Caraco NF, Correll DL et al. Nonpoint pollution of surface waters with phosphorus and nitrogen. Ecological Applications, 1998, 8(3): 559-568. DOI:10.1890/1051-0761(1998)008[0559:NPOSWW]2.0.CO;2 |
| [2] |
Smol JP, Cumming BF. Tracking long-term changes in climate using algal indicators in lake sediments. Journal of Phycology, 2000, 36(6): 986-1011. DOI:10.1046/j.1529-8817.2000.00049.x |
| [3] |
Juggins S, Birks HJB. Quantitative environmental reconstructions from biological data. In: Birks HJB, Lotter AF, Juggins S et al eds. Tracking environmental change using lake sediments: data handling and numerical techniques. Dordrecht: Springer, 2012: 431-494. DOI: 10.1007/978-94-007-2745-8_14.
|
| [4] |
Bennion H, Battarbee RW, Sayer CD et al. Defining reference conditions and restoration targets for lake ecosystems using palaeolimnology: A synthesis. Journal of Paleolimnology, 2011, 45(4): 533-544. DOI:10.1007/s10933-010-9419-3 |
| [5] |
沈吉, 薛滨, 吴敬禄等. 湖泊沉积与环境演化. 北京: 科学出版社, 2010.
|
| [6] |
Battarbee RW, Anderson NJ, Jeppesen E et al. Combining palaeolimnological and limnological approaches in assessing lake ecosystem response to nutrient reduction. Freshwater Biology, 2005, 50(10): 1772-1780. DOI:10.1111/j.1365-2427.2005.01427.x |
| [7] |
Yang XD, Wang R, Dong XH et al. A review of lake palaeoecology research in China. J Lake Sci, 2020, 32(5): 1380-1395. [羊向东, 王荣, 董旭辉等. 中国湖泊古生态研究进展. 湖泊科学, 2020, 32(5): 1380-1395. DOI:10.18307/2020.0512] |
| [8] |
Birks HJB. Quantitative palaeoenvironmental reconstructions. In: Maddy D, Brew JS eds. Statistical modelling of quaternary science data. Cambridge: Quaternary Research Association, 1995.
|
| [9] |
Juggins S, Anderson NJ, Hobbs JMR et al. Reconstructing epilimnetic total phosphorus using diatoms: Statistical and ecological constraints. Journal of Paleolimnology, 2013, 49(3): 373-390. DOI:10.1007/s10933-013-9678-x |
| [10] |
Imbrie J, Kipp NG. A new micropaleontological method for quantitative paleoclimatology: application to a Late Pleistocene Caribbean core. In: Turekian KK ed. The late Cenozoic Glacial Ages. New Haven and London: Yale University Press, 1971.
|
| [11] |
Gaiser EE. The diatoms: Applications for the environmental and earth sciences. Limnology and Oceanography, 2000, 45(3): 751. DOI:10.4319/lo.2000.45.3.0751 |
| [12] |
Lotter AF. The recent eutrophication of Baldeggersee (Switzerland) as assessed by fossil diatom assemblages. The Holocene, 1998, 8(4): 395-405. DOI:10.1191/095968398674589725 |
| [13] |
Bennion H. A diatom-phosphorus transfer function for shallow, eutrophic ponds in southeast England. Hydrobiologia, 1994, 275/276(1): 391-410. DOI:10.1007/BF00026729 |
| [14] |
Chen GJ, Dalton C, Leira M et al. Diatom-based total phosphorus (TP) and pH transfer functions for the Irish Ecoregion. Journal of Paleolimnology, 2008, 40(1): 143-163. DOI:10.1007/s10933-007-9148-4 |
| [15] |
Enache M, Prairie YT. WA-PLS diatom-based pH, TP and DOC inference models from 42 lakes in the Abitibi clay belt area (Québec, Canada). Journal of Paleolimnology, 2002, 27(2): 151-171. DOI:10.1023/A:1014281128544 |
| [16] |
Dong XH, Yang XD, Wang R et al. A diatom-total phosphorus transfer function for lakes in the middle and lower reaches of Yangtze River. J Lake Sci, 2006, 18(1): 1-12. [董旭辉, 羊向东, 王荣等. 长江中下游地区湖泊硅藻-总磷转换函数. 湖泊科学, 2006, 18(1): 1-12. DOI:10.18307/2006.0101] |
| [17] |
Yang XD, Anderson NJ, Dong XH et al. Surface sediment diatom assemblages and epilimnetic total phosphorus in large, shallow lakes of the Yangtze floodplain: Their relationships and implications for assessing long-term eutrophication. Freshwater Biology, 2008, 53(7): 1273-1290. DOI:10.1111/j.1365-2427.2007.01921.x |
| [18] |
Sui FY, Zang SY, Fan YW et al. Establishment of a diatom-total phosphorus transfer function for lakes on the Songnen Plain in northeast China. Journal of Oceanology and Limnology, 2020, 38(6): 1771-1786. DOI:10.1007/s00343-019-9223-5 |
| [19] |
Telford RJ, Birks HJB. A novel method for assessing the statistical significance of quantitative reconstructions inferred from biotic assemblages. Quaternary Science Reviews, 2011, 30(9/10): 1272-1278. DOI:10.1016/j.quascirev.2011.03.002 |
| [20] |
Tao JS, Chen GJ, Chen XL et al. Long-term pattern of diatom community structure changes in response to multiple environmental stressors at Datun Lake, Southeast Yunnan, China. Chinese Journal of Applied Ecology, 2015, 26(8): 2525-2533. [陶建霜, 陈光杰, 陈小林等. 多重环境压力下大屯海硅藻群落结构的长期变化. 应用生态学报, 2015, 26(8): 2525-2533. DOI:10.13287/j.1001-9332.20150610.010] |
| [21] |
Shi HB, Chen GJ, Lu HB et al. Regional pattern of Bosmina responses to fish introduction and eutrophication in four large lakes from Southwest China. Journal of Plankton Research, 2016, 38(3): 443-455. DOI:10.1093/plankt/fbv118 |
| [22] |
Wang JY, Chen GJ, Huang LP et al. Spatio-temporal patterns and drivers of cyanobacteria blooms in Erhai Lake, Southwest China. Chinese Journal of Plant Ecology, 2017, 37(14): 4831-4842. [王教元, 陈光杰, 黄林培等. 洱海蓝藻爆发的时空特征及影响因子. 生态学报, 2017, 37(14): 4831-4842. DOI:10.5846/stxb201604200740] |
| [23] |
Qian FM, Zhang K, Chen GJ et al. Sediment-inferred recent pattern and drivers of environmental and ecological changes at Lake Qilu, Yunnan Province. J Lake Sci, 2018, 30(4): 1109-1122. [钱福明, 张恺, 陈光杰等. 云南杞麓湖沉积物记录的近现代生态环境变化及影响因子识别. 湖泊科学, 2018, 30(4): 1109-1122. DOI:10.18307/2018.0423] |
| [24] |
Chen XL, Chen GJ, Lu HB et al. Long-term diatom biodiversity responses to productivity in lakes of Fuxian and Dianchi. Biodiversity Science, 2015, 23(1): 89-100. [陈小林, 陈光杰, 卢慧斌等. 抚仙湖和滇池硅藻生物多样性与生产力关系的时间格局. 生物多样性, 2015, 23(1): 89-100. DOI:10.17520/biods.2014213] |
| [25] |
Li R, Chen GJ, Kang WG et al. Spatio-temporal variations of diatom community and their relationship with water environment in Fuxian Lake. Environmental Science, 2018, 39(7): 3168-3178. [李蕊, 陈光杰, 康文刚等. 抚仙湖硅藻群落的时空变化特征及其与水环境的关系. 环境科学, 2018, 39(7): 3168-3178. DOI:10.13227/j.hjkx.201710188] |
| [26] |
Hu K, Chen GJ, Gregory-Eaves I et al. Hydrological fluctuations modulate phototrophic responses to nutrient fertilization in a large and shallow lake of Southwest China. Aquatic Sciences, 2019, 81(2): 1-17. DOI:10.1007/s00027-019-0633-4 |
| [27] |
Liu YY, Chen GJ, Shi HB et al. Responses of a diatom community to human activities and climate changes in Xingyun Lake. Acta Ecologica Sinica, 2016, 36(10): 3063-3073. [刘园园, 陈光杰, 施海彬等. 星云湖硅藻群落响应近现代人类活动与气候变化的过程. 生态学报, 2016, 36(10): 3063-3073. DOI:10.5846/stxb201412122477] |
| [28] |
Liu YY, Chen GJ, Hu K et al. Biological responses to recent eutrophication and hydrologic changes in Xingyun Lake, southwest China. Journal of Paleolimnology, 2017, 57(4): 343-360. DOI:10.1007/s10933-017-9952-4 |
| [29] |
Dong XH, Yang XD, Liu EF. Diatom records and reconstruction of epilimnetic phosphorus concentration in Lake Taibai (Hubei Province) over the past 400 years. J Lake Sci, 2006, 18(6): 597-604. [董旭辉, 羊向东, 刘恩峰. 湖北太白湖400多年来沉积硅藻记录及湖水总磷的定量重建. 湖泊科学, 2006, 18(6): 597-604. DOI:10.18307/2006.0607] |
| [30] |
隋丰阳. 基于松嫩平原湖泊群硅藻-总磷转换函数的湖泊营养演化重建——以查干湖为例[学位论文]. 哈尔滨: 哈尔滨师范大学, 2019.
|
| [31] |
Telford RJ, Andersson C, Birks HJB et al. Biases in the estimation of transfer function prediction errors. Paleoceanography, 2004, 19(4): PA4014. DOI:10.1029/2004PA001072 |
| [32] |
Cai QH. On the comprehensive evaluation methods for lake eutrophication. J Lake Sci, 1997, 9(1): 89-94. [蔡庆华. 湖泊富营养化综合评价方法. 湖泊科学, 1997, 9(1): 89-94. DOI:10.18307/1997.0114] |
| [33] |
国家环境保护总局《水和废水监测分析方法》编委会. 水和废水监测分析方法: 第四版. 北京: 中国环境科学出版社, 2002.
|
| [34] |
Battarbee RW, Jones VJ, Flower RJ et al. Diatoms. In: Smol JP, Birks HJB, Last WM eds. Terrestrial, algal, and siliceous indicators. Dordrecht: Kluwer Academic Publishers, 2001.
|
| [35] |
Krammer K, Lange-Bertalot H. Bacillariophyceae. In: Ettl H, Gerloff J, Heynig H et al eds. Süβwasserflora von Mitteleuropa. Stuttgart: Fischer-Verlag, 1986-1991.
|
| [36] |
Li YL, Gong ZJ, Shen J. Effects of eutrophication and temperature on Cyclotella rhomboideo-elliptica Skuja, endemic diatom to China. Phycological Research, 2012, 60(4): 288-296. DOI:10.1111/j.1440-1835.2012.00659.x |
| [37] |
ter Braak CJF, Prentice IC. A theory of gradient analysis. Advances in Ecological Research, 1988, 18: 271-317. DOI:10.1016/S0065-2504(08)60183-X |
| [38] |
Gregory-Eaves I, Smol JP, Finney BP et al. Diatom-based transfer functions for inferring past climatic and environmental changes in Alaska, USA. Arctic, Antarctic, and Alpine Research, 1999, 31(4): 353-365. DOI:10.1080/15230430.1999.12003320 |
| [39] |
ter Braak CJF, Juggins S. Weighted averaging partial least squares regression (WA-PLS): An improved method for reconstructing environmental variables from species assemblages. Hydrobiologia, 1993, 269/270(1): 485-502. DOI:10.1007/BF00028046 |
| [40] |
R Core Team ed. R: a language and environment for statistical computing. R Foundation for Statistical Computing, Vienna, 2019.
|
| [41] |
Oksanen J, Blanchet FG, Friendly M et al eds. Vegan: community ecology package. R package version 2.5-6, 2017.
|
| [42] |
Juggins S ed. C2 user guides-software for ecological and palaeoecological data analysis and visualization. Newcastle upon Tyne, 2003.
|
| [43] |
Juggins S ed. Rioja: an R package for the analysis of quaternary science data, version 0.9-26, 2009.
|
| [44] |
Telford R ed. PalaeoSig: Significance tests for palaeoenvironmental reconstructions, version 2.0-3, 2015.
|
| [45] |
Birks HJB. Numerical tools inpalaeolimnology-progress, potentialities, and problems. Journal of Paleolimnology, 1998, 20: 307-332. DOI:10.1023/A:1008038808690 |
| [46] |
Shi LL, Yang XH. Study on water quality change of nitrogen and phosphorus of three large lakes in Yunnan. Environmental Science Survey, 2007, 26(S1): 67-69, 73. [师莉莉, 杨晓红. 滇中三大湖泊氮、磷水质变化趋势研究. 环境科学导刊, 2007, 26(S1): 67-69, 73.] |
| [47] |
Luo Y, Xiao Y, Zhang XX et al. The countermeasures of nitrogen and phosphorus pollution prevention and control in the watershed of Fuxian Lake and Xingyun Lake—based on the data from 2000 to 2015. Environmental Protection Science, 2020, 46(1): 106-112, 161. [罗玉, 肖尧, 张晓旭等. 抚仙湖-星云湖流域氮、磷污染防治对策研究——以2000—2015年数据为例. 环境保护科学, 2020, 46(1): 106-112, 161.] |
| [48] |
Dong XH, Yang XD, Wang R. Diatom indicative species of eutrophication of the lakes in the middle and lower reach regions of Yangtze River. China Environmental Science, 2006, 26(5): 570-574. [董旭辉, 羊向东, 王荣. 长江中下游地区湖泊富营养化的硅藻指示性属种. 中国环境科学, 2006, 26(5): 570-574. DOI:10.3321/j.issn:1000-6923.2006.05.014] |
| [49] |
Birks H, Line JM, Juggins S et al. Palaeolimnology and lake acidification. In: Diatoms and pH reconstruction. philosophical transactions of the royal society of London. Series B, Biological Sciences, 1990, 327(1240): 263-278. DOI: 10.1098/rstb.1990.0062.
|
| [50] |
Kilham SS, Kilham P. Melosira granulata (Ehr. ) Ralfs: Morphology and ecology of a cosmopolitan freshwater diatom. SIL Proceedings, 1922-2010, 1975, 19(4): 2716-2721. DOI: 10.1080/03680770.1974.11896368.
|
| [51] |
Håkansson H, Bailey-Watts AE. A contribution to the taxonomy of Stephanodiscus hantzschii Grunow, a common freshwater planktonic diatom. Diatom Research, 1993, 8(2): 317-332. DOI:10.1080/0269249X.1993.9705265 |
| [52] |
Stoermer EF, Yang JJ. Plankton diatom assemblages in Lake Michigan. Univ. Michigan, Great Lakes Res. Div. Spec. Rep, 1969, 47: 168. |
| [53] |
Anderson NJ. The biostratigraphy and taxonomy of small Stephanodiscus and Cyclostephanos species (Bacillariophyceae) in a eutrophic lake, and their ecological implications. British Phycological Journal, 1990, 25(3): 217-235. DOI:10.1080/00071619000650211 |
| [54] |
Hall RI, Smol JP. A weighted—averaging regression and calibration model for inferring total phosphorus concentration from diatoms in British Columbia (Canada) lakes. Freshwater Biology, 1992, 27(3): 417-434. DOI:10.1111/j.1365-2427.1992.tb00551.x |
| [55] |
Kang WG, Chen GJ, Wang JY et al. Identification of the long-term patterns of catchment development and diatom community changes in Xihu Lake, Dali, Yunnan, China. Chinese Journal of Applied Ecology, 2017, 28(3): 1001-1012. [康文刚, 陈光杰, 王教元等. 大理西湖流域开发历史与硅藻群落变化的模式识别. 应用生态学报, 2017, 28(3): 1001-1012. DOI:10.13287/j.1001-9332.201703.040] |
| [56] |
Bennion H, Davidson TA, Sayer CD et al. Harnessing the potential of the multi-indicator palaeoecological approach: An assessment of the nature and causes of ecological change in a eutrophic shallow lake. Freshwater Biology, 2015, 60(7): 1423-1442. DOI:10.1111/fwb.12579 |
| [57] |
Wetzel RG. Limnology (2nd edition). Philadelphia: Saunders College Publication, 1983.
|
| [58] |
Reynolds CS. The ecology of freshwater phytoplankton. Cambridge: Cambridge University Press, 1984.
|
| [59] |
Anderson NJ. Reconstructing historical phosphorus concentrations in rural lakes using diatom models. In: Tunney H, Carton OT, Brookes PC eds. Phosphorus loss from soil to water. Wallingford: Cab International, 1997.
|
| [60] |
Jones VJ, Juggins S. The construction of a diatom-based chlorophyll a transfer function and its application at three lakes on Signy Island (maritime Antarctic) subject to differing degrees of nutrient enrichment. Freshwater Biology, 1995, 34(3): 433-445. DOI:10.1111/j.1365-2427.1995.tb00901.x |
| [61] |
Braak CJF, Looman CWN. Weighted averaging, logistic regression and the Gaussian response model. Vegetatio, 1986, 65(1): 3-11. DOI:10.1007/BF00032121 |
| [62] |
Qi YZ. Flora Algarum Sinicarum Aquae Dulcis, Tomus IV, Bacillariophyta, Centricae. Beijing: Science Press, 1995.
|
| [63] |
冯明刚. 玉溪市星云湖环境现状及可持续发展研究[学位论文]. 昆明: 昆明理工大学, 2005.
|
 2023, Vol. 35


