(2: 中国科学院南京地理与湖泊研究所, 湖泊与流域水安全重点实验室, 南京 210008)
(3: 中国科学院南京地理与湖泊研究所, 鄱阳湖湖泊湿地综合研究站, 九江 332899)
(4: 河海大学港口海岸与近海工程学院, 南京 210024)
(2: Key Laboratory of Lake and Watershed Science for Water Security, Nanjing Institute of Geography and Limnology, Chinese Academy of Sciences, Nanjing 210008, P. R. China)
(3: Poyang Lake Wetland Research Station, Nanjing Institute of Geography and Limnology, Chinese Academy of Sciences, Jiujiang 332899, P. R. China)
(4: College of Harbour Coastal and Offshore Engineering, Hohai University, Nanjing 210024, P. R. China)
浮游植物在淡水生态系统中具有重要作用。作为重要初级生产者,浮游植物利用阳光、二氧化碳和水生产有机物质,为鱼类、甲壳类动物、贝类等高级生物提供食物,是食物链的基础。浮游植物还为多数消费者提供新陈代谢所需的氧气,在地质年代进程中,蓝藻提高了大气的氧气含量,促进了有氧生命的进化[1]。由于个体小、代谢快,浮游植物的群落特征与时空分布受众多环境因子的影响,包括温度、光照、营养、水动力以及对应流域的土地利用等[2-4]。
在不同类型/区域水体中,浮游植物群落变化规律存在一定差异;国内外学者采用跟踪监测、遥感解译等方法,解析了浮游植物的时空分布特征[5-7]。时间上,夏、秋季期间,富营养湖库浮游植物以蓝藻门、绿藻门为主要优势种群,其中部分湖库的蓝藻门占绝对优势,贫营养湖库浮游植物以绿藻门、硅藻门为主要优势种群;冬、春季期间,多数湖库以硅藻门、隐藻门等为主要优势种群[8-11];除浮游植物优势种外,湖库浮游植物的密度及生物量季节变化明显,一般呈现夏季>秋季>春季>冬季的变化趋势[7, 12-14]。空间上,水库库区浮游植物的生物量与密度一般高于其支流,且上、中、下游生物量呈现先增加、后减少的趋势[15-16]。与湖库不同,沟塘等小微水体浮游植物以蓝藻门、绿藻门为主要优势种群,其中养殖池塘的浮游植物种群演替规律与养殖周期密切相关,浮游植物密度普遍呈现养殖初期低、养殖后期较高的特点[17-19]。养殖坑塘的浮游植物空间差异不明显,主要受水产养殖影响[20]。
在探究浮游植物群落时空变化规律基础上,部分学者通过对气象、水质、水生态与人类活动等方面数据的联合分析,解析了浮游植物群落变化的影响因子[11, 21]。研究发现:温度、总氮、总磷、光照、溶解氧等是河流湖库浮游植物的主要影响因子[9, 22-23],少数案例还发现化学需氧量、pH等环境因子也是浮游植物演替的影响因子[14, 24-25]。而沟塘等小微水体体积小,周边人类活动影响大,浮游植物也呈现强人类干扰的特点[26]。
由此可见,以往水体浮游植物研究案例主要聚集在包括河流[27]、湖泊[28]、水库[29]等大水面水域,少量小微水体的浮游植物研究关注高效藻类塘[30]、稳定塘[31]、养殖坑塘[26]等,对平原区广泛分布农业坑塘的浮游植物群落研究较少[20]。而在我国长江下游的太湖流域平原河网区,农业坑塘分布广,其中淡水养殖池塘面积高达1308.6 km2[32]。圩塘是圩区的汇水区,也是圩内外水量交换的重要节点,其水生态环境质量直接影响圩区排水水质,深刻影响太湖及其周边河网水质[33]。其中,浮游植物群落是反映圩塘生态系统变化的重要指标[34-35],因此,有必要针对平原圩塘,解析浮游植物群落的动态变化及其影响因子,深化对区域小微水体及其周边河湖水生态健康状况的认识。
为明晰太湖流域农业圩塘的浮游植物变化规律及其影响因子,本研究选择太湖流域湖西区典型农业圩区的坑塘(圩塘),开展浮游植物及相关环境因子的周年观测,利用浮游植物多样性指数、生物优势度与功能群指数,分析浮游植物群落动态变化规律;构建反映浮游植物对环境因子响应的结构方程模型(SEM),解析环境因子对浮游植物的驱动机制,进而对比总结平原农业圩塘浮游植物群落的变化规律及其与河流湖库等大水面水域的差异。
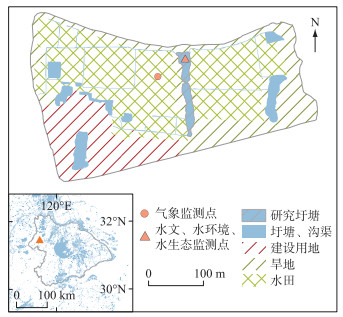
1 材料与方法 1.1 研究区研究区为位于长江下游太湖流域溧阳的典型农业圩区坑塘(圩塘,图 1),该圩区(尖圩,面积为10.64 hm2)土地利用类型主要包括水域、水田、旱地、建设用地,面积分别为9.6×10³、5.3×10⁴、2.3×10⁴、2.0×10⁴ m2,圩区所在区域年均降雨量1168 mm,年均气温16.6 ℃,农田主要采用稻麦轮作模式,其中稻季为6—11月,麦季为12—5月[36];圩塘承接圩内陆域来水,其水生态环境特征与周边土地利用密切相关,而尖圩土地利用等特征与太湖流域多数农业圩相似,因此选择的圩塘具有较好代表性。与山丘自然流域相比,圩区水文过程具有强人工调控特征,体现在:圩区水文过程被堤坝和泵站所分割,圩内外水体交换主要通过灌溉抽水、洪涝排水、涵洞引排水等人工调控的水文过程完成,圩内水深也因此呈现剧烈变化特征(图 2);稻季期间,通过泵站抽水/涵洞引水满足稻田灌溉需要,强降雨期间,圩外河流水位普遍高于圩内地面高程,圩内积水无法通过涵洞自流外排,泵站排涝至周围河道成为圩区积水外排的重要途径[37];上述强人工调控的水文过程深刻改变了圩内营养迁移转化与水生生物生消等过程。
|
图 1 太湖流域典型农业圩(溧阳尖圩)的地理位置与土地利用 Fig.1 Location and land use of a typical agricultural polder at Lake Taihu Basin (Polder Jian, Liyang) |

|
图 2 2022年太湖流域典型圩塘的气象与水文条件 Fig.2 Meteorological and hydrological conditions at the studied pond of Lake Taihu Basin in 2022 |
2012年起,中国科学院南京地理与湖泊研究所在研究区布设了气象与水文相关要素的自动观测设备,开展水样定期采集与测试分析,已初步形成了涵盖气象、水文、水环境、水生态定期观测的太湖流域典型圩区生态系统观测研究站(点)。依托该研究站,为研究圩塘浮游植物及相关环境因子的动态变化规律,于2022年开展了气象、水文、水环境与水生态要素的系统监测,监测点位见图 1,监测指标与频次等信息见表 1。
| 表 1 太湖流域典型圩塘的气象、水文、水环境、水生态观测 Tab. 1 Meteorological, hydrological, environmental and ecological dataset from the typical agricultural pond within Polder Jian at Lake Taihu Basin |
气象要素包括气温(Tem)和降水(Pr),分别由温度光照度记录仪(HOBO UA-002-64)和自记式雨量筒(HOBO RG3-M)自动记录。水文要素包括水深(WD),由水位记录仪(HOBO U20)记录。水环境要素包括浊度(Tur)、总磷(TP)、总氮(TN)、溶解性总磷(DTP)、溶解性总氮(DTN)、正磷酸盐磷(PO43--P)、硝态氮(NO3--N)、亚硝态氮(NO2--N)、氨氮(NH3-N)、溶解性有机碳(DOC)和溶解性无机碳(DIC),通过现场采样与实验室测试分析获取,方法详见《湖泊调查技术规程》[38]。
水生态要素包括圩塘水体浮游植物群落密度与生物量,通过水样采集与显微镜鉴定获取,浮游植物样品采集流程包括采用25号(64 μm孔径)浮游生物网捞取,定量样品取1 L充分摇匀后的混合水样,倒入试剂瓶中之后加体积分数为1 % 的鲁哥试剂固定。样品带回实验室静置沉淀48 h后,利用虹吸法吸除上清液并定容至30 mL。浮游植物的鉴定和计数使用光学显微镜Olympus BX41,参照《中国淡水藻类:系统、分类及生态》[39]。浮游植物计数时,将计数样品充分摇匀后,迅速吸取0.1 mL水样于浮游植物计数框(面积为20 mm×20 mm)中,盖上盖玻片,保证计数框内无气泡,也无样品溢出,在40倍物镜下观察100个视野,每个样品至少计数300个细胞[39]。由于浮游藻类的细胞密度接近于水的密度(1 g/mL),故生物量测定采用体积转化法。细胞平均体积根据物种的几何形状计算[40]。
1.3 数据处理与分析方法 1.3.1 浮游植物评价方法采用种群/功能群优势度(Y)表征浮游植物的生态重要性,由对应门/种/功能群的出现频率与相对生物量计算,公式为:
| Yi=fi⋅Pi | (1) |
式中,Yi为第i门/种/功能群浮游植物的种群优势度;fi为第i门/种/功能群的出现频率;Pi为第i门/种/功能群生物量占总生物量的比例。当Y>0.02时,种群为优势门/种/功能群;当Y>0.2时,种群为重要优势门/种/功能群。
采用多样性指数(Simpson、Shannon-Wiener和Pielou指数)、功能群指数(Q)表征浮游植物种群特征。其中功能群分类依据见附表Ⅰ,功能群指数采用Padisák等提出的Q指数表征[41],计算公式为:
| Q=N∑i=1Pi⋅Fi | (2) |
式中,N为浮游植物功能群的总数;Pi为第i种功能群生物量占总生物量的比例;Fi为第i种功能群的赋值(附表Ⅰ)。Q与Fi的取值范围为0~5,分别表示:0~1差;1~2耐受;2~3中等;3~4好;4~5极好。
1.3.2 影响因子分析方法基于浮游植物评价结果,采用相关系数法分析浮游植物与环境因子的相关性;在此基础上,构建结构方程模型(structural equation modeling,SEM)解析环境因子对浮游植物的影响。其中,相关分析采用Spearman秩相关系数评价,该系数是一种非参数测量相关性的量化指标,用于确定浮游植物与环境因子之间的关系[42],采用Python编程语言的SciPy模块计算。结构方程模型是一种融合了因素分析和路径分析的方法,该方法基于变量的协方差矩阵,分析单项指标对总体的作用和指标间的相互关系;基于Mplus软件平台,根据Spearman相关性分析结果与现有机理过程认识,设计浮游植物相关指数与环境因子之间图谱,构建SEM模型,利用卡方与自由度的比值(χ2/df)比较拟合指数(CFI)与非标准拟合指数(TLI)3项指数评价模型的合理性。χ2/df小于3,表明模型结果良好;CFI与TLI大于0.8,表明模型结果可接受。
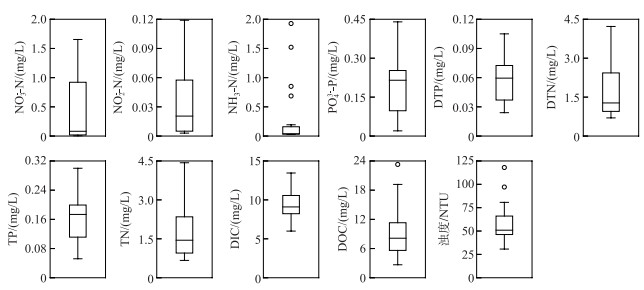
2 结果与讨论 2.1 圩塘环境因子变化2022年,圩塘所在区域年降水量为913 mm,年均气温为19.7 ℃,水深为(1.20±0.23) m(图 2)。圩塘水质属于劣V类,其中NO3--N浓度为(0.47±0.56) mg/L,NO2--N浓度为(0.035±0.035) mg/L,NH3-N浓度为(0.26±0.49) mg/L,PO43--P浓度为(0.019±0.010) mg/L,DTP浓度为(0.059±0.022) mg/L,DTN浓度为(1.73±0.96) mg/L,TP浓度为(0.16±0.06) mg/L,TN浓度为(1.74±0.95) mg/L,DIC浓度为(9.25±1.86) mg/L,DOC浓度为(9.17±4.77) mg/L,浊度为(56.65±19.69) NTU(图 3)。
|
图 3 2022年太湖流域典型圩塘的水环境条件 Fig.3 Variations of environmental conditions at the studied pond of Lake Taihu Basin in 2022 |
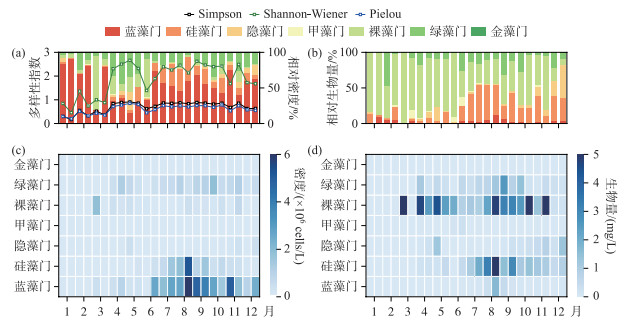
圩塘水样共检测出浮游植物7门55属73种,其中绿藻36种、硅藻14种、蓝藻12种、隐藻4种、甲藻3种、裸藻3种和金藻1种。月平均密度为(3.46±3.45)×106 cells/L,月平均生物量为(4.21±3.48) mg/L。
圩塘浮游植物群落结构具有显著季节变化特征(P < 0.05)。对于浮游植物相对密度,蓝藻最高,其月均值为54.8 % ±20.9 %。春季期间,浮游植物相对密度较高的物种主要包括蓝藻(35.1 % ±23.2 %)、裸藻(26.4 % ±25.1 %)和绿藻(25.9 % ±15.6 %),夏、秋、冬季,蓝藻相对密度均高于40 % (图 4)。对于浮游植物相对生物量,裸藻在全年占据优势,月均相对生物量为56.5 % ±24.6 %,其中囊裸藻(Trachelomonas sp.,Y=0.72)与裸藻(Euglena sp.,Y=0.26)是重要优势种,其次是硅藻(20.4 % ±16.4 %)。全年均为优势门的为裸藻门(Y=0.59)和硅藻门(Y=0.21),其中,裸藻门的生物量占比高(59.5 %)(图 4)。Simpson指数、Shannon-Wiener指数与Pielou指数全年呈现类似的季节变化规律:夏季>秋季>春季>冬季,在冬季普遍偏低,表明冬、春季物种的丰富度与均匀度均较低,在晚春快速升高,夏、秋季物种的丰富度与均匀度同步上升,保持平稳波动至秋末,上述多样性指数季节变化规律与湖库水体总体相似[7, 43];但在2022年6月,多样性指数显著下降(图 4),可能是由于灌溉大量引水导致浮游植物群落结构剧变(图 2)。
|
图 4 2022年太湖流域典型圩塘浮游植物的密度、生物量和多样性指数 Fig.4 Densities, biomasses and diversity indexes of phytoplankton at the studied pond of Lake Taihu Basin in 2022 |
圩塘浮游植物的上述演替规律与大水面水域有一定差异。在大水面水域中,夏、秋季普遍以蓝藻门、绿藻门和硅藻门占优势[8, 11],冬、春季以硅藻门和隐藻门占优势[9-10, 44]。与大水面水域相比,圩塘浮游植物演替的独特性体现在:裸藻门为浮游植物群落的优势门。裸藻门通常出现在有机质浓度较高的水域[45],其中圩塘出现的裸藻属与囊裸藻属含叶绿素,可光合自养,也可通过吞噬作用摄入食物,降解水体有机物[46-47]。裸藻对于高有机物水体具有明显净化作用,表明研究区具有一定的天然净化能力。
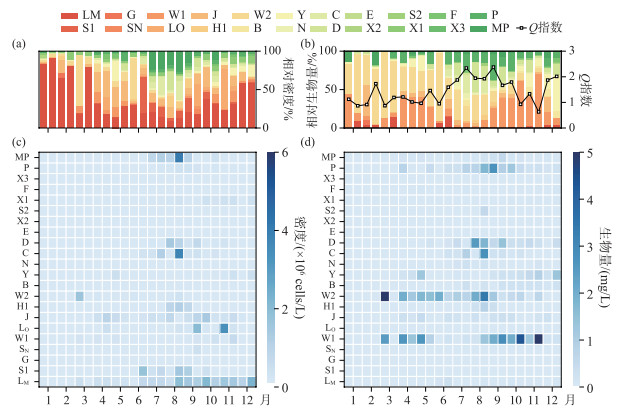
2.2.2 浮游植物功能群划分圩塘水样共检测出22个功能群:B、C、D、N、P、S1、S2、SN、X3、X2、X1、Y、E、F、G、J、H1、LO、LM、W1、W2和MP(附表Ⅰ)。功能群指数变化范围为0.63≤Q≤2.38,季节变化规律为:夏季>秋季>冬季>春季(图 5)。依据圩塘氮、磷浓度(年均TP=0.16 mg/L,TN=1.73 mg/L),水质属于劣V类,与Q指数结果总体一致。优势功能群共9个(Y>0.02):B、C、D、P、Y、J、W1、W2和MP,多数为适应中富营养水体的类群。
|
图 5 2022年太湖流域典型圩塘浮游植物功能群的密度、生物量和功能群指数 Fig.5 Densities, biomass and assemblage index at the studied pond of Lake Taihu Basin in 2022 |
P、J、W1、W2全年均为优势功能群(图 5),指示圩塘长期处于富营养、浑浊、混合作用强烈的状态。功能群P以新月藻(绿藻门)为代表属,偏好富营养水体,个体较大,能抵抗扰动水体中的水流冲刷,但在静水条件下易沉降,因此该功能群对水体分层敏感;功能群J以栅藻(绿藻门)为代表属,偏好富营养的浑浊浅水,对高光照敏感;功能群W1以裸藻(裸藻门)为代表属,适应富营养水体,耐受有机污染;功能群W2以囊裸藻(裸藻门)为代表属,适应中营养的浅水环境[48-49]。
浮游植物功能群季节变化明显:春季以适应静态水体的功能群为主,夏季以适应混合作用强烈的功能群为主,秋季以适应富营养化环境的功能群为主,冬季以适应浑浊水体的功能群为主。优势功能群组成随季节的变化规律为P、Y、J、W1、W2(春季:3—5月)→ C、D、N、P、J、H1、LM、W1、W2、MP(夏季:6—8月)→ B、C、D、P、Y、J、W1、W2、MP(秋季:9—11月)→ B、D、P、Y、J、LM、W1、W2、MP(冬季:12—2月)(图 5),其中重要功能群(Y>0.2)包括P、Y、W1、W2。
麦季期间(12—5月),季节优势功能群为Y。功能群Y以隐藻为代表属,适应性较强,对食物链上游的摄食较为敏感。冬季,水体优势功能群包括:指示富营养化环境的功能群B(大型群体硅藻)和LM(微囊藻等)、指示浑浊水体的功能群D以及指示混合水体的功能群MP。相比冬季,春季浮游植物群落优势种类减少,喜好混合水体的功能群优势度大幅降低,水体较冬季流速下降;同时,极偏好富营养化环境的部分功能群优势度也下降。
稻季期间(6—11月),季节优势功能群包括C、D和MP。功能群C与B生境接近(大型群体硅藻),指示水体混合作用较强,但其指示的水体营养化程度相比B更低;功能群D与MP均指示水体处于混合扰动且富营养的状态。夏季,分别以鱼腥藻(固氮蓝藻)和微囊藻(蓝藻)为代表属的功能群H1和LM为优势功能群,指示强烈季节性混合过程的N功能群也为优势群。秋季,生物量整体下降,仅有裸藻保持优势到冬季。秋季的特征优势功能群为B和Y。B功能群指示水体营养化程度加深;Y功能群恢复优势指示牧食压力下降。上述分析结果表明,圩塘春季混合作用最弱;冬季牧食活动最弱;夏季混合作用最强,固氮、牧食等微生物活动活跃。
2.3 圩塘浮游植物与环境因子的相关性Spearman相关系数矩阵(图 6)显示,多样性指数与温度、氮、磷相关指标显著相关,功能群指数与水深、DOC显著相关。浮游植物的3项多样性指数(Simpson、Shannon-Wiener和Pielou)与环境因子间的相关性总体相似;多样性指数与温度、DOC均呈现显著正相关(P < 0.01),与氮相关指标(NO3--N、NO2--N、NH3-N、DTN、TN)呈现显著负相关(P < 0.01),与大部分磷相关指标(DTP、TP)呈现较为显著的正相关(P < 0.05),但与正磷酸盐磷(PO43--P)的关系不显著。浮游植物功能群指数(Q)仅与水深、DOC呈现显著正相关(P < 0.05)。
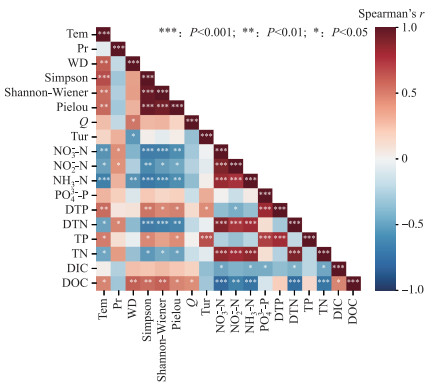
|
图 6 浮游植物与环境因子之间的Spearman相关系数热力图(变量全称见1.2与1.3节) Fig.6 Heatmap of Spearman's rank correlation coefficients between phytoplankton and environmental factors |
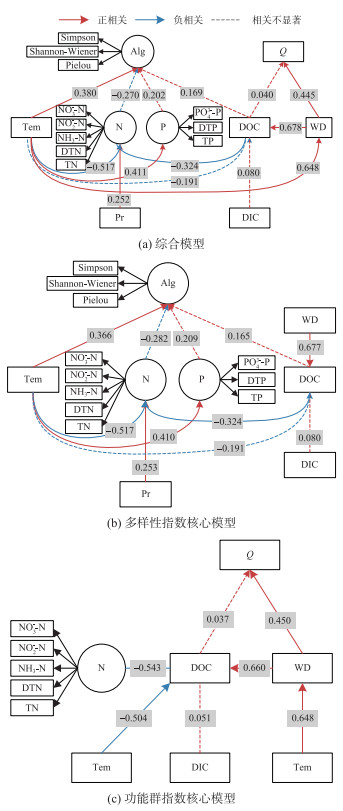
本研究构建的SEM模型合理可靠,适配程度可接受(图 7)。综合模型直接依据相关系数矩阵构建,多样性指数核心模型仅包含与多样性指数相关的环境因子,功能群指数核心模型仅包含与功能群指数相关的环境因子。上述3个模型的χ2/df均小于2,CFI均大于0.8,TLI均大于0.72(表 2)。多样性指数核心模型较综合模型的χ2/df下降,CFI和TLI有不同程度上升,表明多样性指数核心模型解释性上升;但对功能群指数核心模型,χ2/df上升,CFI和TLI有不同程度下降,表明功能群指数核心模型解释性下降。潜在变量(浮游植物多样性(Alg))对Simpson指数(1.0)、Shannon-Wiener指数(1.003)和Pielou(1.001)指数具有显著负载因子。
|
图 7 浮游植物群落指数与环境因子的SEM模型估计结果(变量全称见1.2与1.3节) Fig.7 Diagram of the estimated results for SEM between phytoplankton indexes and environmental factors |
| 表 2 基于Spearman分析矩阵构建的SEM模型的评价结果 Tab. 2 Evaluations of SEM models based on Spearman analysis matrix |
SEM模型分析结果表明:温度与水深变化可以解释浮游植物群落的大部分变化。温度与浮游植物多样性存在显著正相关,标准化路径为0.380。潜在变量氮、潜在变量磷、DOC对浮游植物多样性的直接影响路径均不显著,表明气温直接影响浮游植物的多样性,并且不通过其他路径间接调节。水深与浮游植物功能群指数存在显著正相关,标准化路径为0.445。功能群指数与DOC的路径系数不显著。温度与水深存在显著正相关,标准化路径为0.648。
与大水面水域相比,圩塘浮游植物多样性与功能群的影响因子有一定差异。多样性影响因子方面,浮游植物多样性主要受温度影响,与以往研究结论总体一致[22, 27, 50-51],但与浊度(光照强度)、营养的关系不显著,与以往研究结论有差异[20, 52-54],可能原因是圩塘水深浅、受人类干扰强等,农业活动对圩塘浮游植物群落的影响有待深入量化,昼夜变化明显、受人类活动影响大的相关指标(pH与溶解氧等)也需要进一步关注。在一定营养水平下,温度升高会促进浮游植物的生长、代谢与繁殖[52, 55]。不同类型浮游植物对温度的响应不同。例如,与其他物种相比,蓝藻更容易适应温度升高的环境,竞争优势明显[56],部分解释了蓝藻在夏季优势度上升的原因。
功能群影响因子方面,功能群指数与水深(水体混合)具有显著正相关,与DOC、浊度(光照)的相关性不显著。浮游植物群落的结构通常取决于营养与光照[57]。对于营养条件,依据氮、磷指标(年均TP=0.16 mg/L,TN=1.73 mg/L),圩塘水质属于劣V类,远高于大部分浮游植物的半饱和常数阈值[58];对于光照条件,圩塘水深浅((1.20±0.23) m)、浊度高((56.7±19.7) NTU),水体内平均光照条件不会发生剧烈变化。而水文条件通过混合/分层效应影响光照与营养的分布,进而影响浮游植物群落功能群的组成,因此,水深(混合)成为比光照与营养更为重要的影响因子。在部分湖库中也存在类似的规律[29, 59-60]。但圩塘属于强人类活动区的小微水体,受人类活动与自然因素的双重干扰,其浮游植物群落的稳定性与河湖水体相比有所不同。
2.5 研究不足本研究采用Spearman分析矩阵与SEM模型两种统计方法,分析了太湖流域农业区典型圩塘浮游植物群落与环境因子的关联,解析两者的动态响应关系。采用的研究方法为统计方法,无法精准刻画群落动态与环境因子之间的关联,后期可在此基础上,构建浮游植物的机理过程模型,量化解析浮游植物对环境因子的响应过程与强度。
3 结论与展望本研究选择太湖流域平原农业区典型圩塘(溧阳尖圩坑塘),联合野外监测、相关分析、结构方程模型等方法,解析了浮游植物群落动态变化规律及其影响因子,研究结果表明:
1) 圩塘浮游植物的全年优势功能群包括P、J、W1、W2,指示了圩塘具有富营养化、浑浊、混合作用强烈等特征;裸藻为全年重要优势门,稻季的优势门还包括硅藻、绿藻与蓝藻,麦季的优势门还包括隐藻与硅藻;多样性指数呈现春、夏、秋季高,冬季低的规律。
2) 温度与水深是浮游植物动态变化的关键影响因子。浮游植物群落多样性主要受温度控制,而功能群变化主要受水深控制。
3) 温度是圩塘与大水面水体浮游植物群落的重要影响因子;与大水面水体不同,圩塘面积小,受人类活动影响强烈,外源氮、磷负荷大,长期处于富营养状态,群落受氮、磷等营养盐影响较小。
4) 太湖流域农业圩塘分布广,是农业退水与降雨汇流的关键节点,对周边河湖水生态环境影响大;因此,本研究可为太湖流域圩塘及其周边河湖水生态保护与调控提供理论依据。
4 附录附表Ⅰ见电子版(DOI: 10.18307/2024.0514)。
| 附表Ⅰ 尖圩圩塘浮游植物功能群分组 Appendix Ⅰ Functional groups of phytoplankton in the pond of Polder Jian |
| [1] |
Schirrmeister BE, de Vos JM, Antonelli A et al. Evolution of multicellularity coincided with increased diversification of cyanobacteria and the Great Oxidation Event. Proceedings of the National Academy of Sciences of the United States of America, 2013, 110(5): 1791-1796. |
| [2] |
Thomas MK, Aranguren-Gassis M, Kremer CT et al. Temperature-nutrient interactions exacerbate sensitivity to warming in phytoplankton. Global Change Biology, 2017, 23(8): 3269-3280. DOI:10.1111/gcb.13641 |
| [3] |
Liu XX, Chen L, Jiang YN et al. Spatiotemporal variation of phytoplankton communities and their relationship with environmental factors in Lake Fuxian. J Lake Sci, 2020, 32(3): 793-803. [刘晓曦, 陈丽, 蒋伊能等. 抚仙湖浮游植物群落时空变化特征及其与环境因子的关系. 湖泊科学, 2020, 32(3): 793-803. DOI:10.18307/2020.0319] |
| [4] |
O'Farrell I, de Tezanos Pinto P, Izaguirre I. Phytoplankton morphological response to the underwater light conditions in a vegetated wetland. Hydrobiologia, 2007, 578(1): 65-77. DOI:10.1007/s10750-006-0434-3 |
| [5] |
Sha LW, Liu G, Wen ZD et al. Spatio-temporal variation rules of cyanobacteria blooms in Taihu Lake using MODIS data. Wetland Science, 2018, 16(3): 432-437. [沙林伟, 刘阁, 温志丹等. 基于MODIS数据的太湖蓝藻水华时空变化规律研究. 湿地科学, 2018, 16(3): 432-437.] |
| [6] |
Shan K, Song LR, Chen W et al. Analysis of environmental drivers influencing interspecific variations and associations among bloom-forming cyanobacteria in large, shallow eutrophic lakes. Harmful Algae, 2019, 84: 84-94. DOI:10.1016/j.hal.2019.02.002 |
| [7] |
Peng X, Zhang L, Li Y et al. The changing characteristics of phytoplankton community and biomass in subtropical shallow lakes: Coupling effects of land use patterns and lake morphology. Water Research, 2021, 200: 117235. DOI:10.1016/j.watres.2021.117235 |
| [8] |
Gao Y, Pan JZ, Li Y et al. Spatio-temporal distribution of phytoplankton and environmental factors in the north part of Lake Gehu (Jiangsu) after muti-treatment. J Lake Sci, 2015, 27(4): 649-656. [高亚, 潘继征, 李勇等. 江苏滆湖北部区整治后浮游植物时空分布及环境因子变化规律. 湖泊科学, 2015, 27(4): 649-656. DOI:10.18307/2015.0413] |
| [9] |
Shi K, Zhang YL, Zhang YB et al. Phenology of phytoplankton blooms in a trophic lake observed from long-term MODIS data. Environmental Science & Technology, 2019, 53(5): 2324-2331. DOI:10.1021/acs.est.8b06887 |
| [10] |
Wang SX, Wei L, Wang S et al. Seasonal changes of phytoplankton community structure and its influencing factors in lakes and reservoirs adjacent to water sources in Shanghai. J Lake Sci, 2022, 34(4): 1127-1139. [王三秀, 魏莱, 王爽等. 上海水源地毗邻湖库浮游植物群落结构的季节变化及其影响因子. 湖泊科学, 2022, 34(4): 1127-1139. DOI:10.18307/2022.0407] |
| [11] |
Huo S, Zhang H, Ma C et al. Algae community response to climate change and nutrient loading recorded by sedimentary phytoplankton pigments in the Changtan Reservoir, China. Journal of Hydrology, 2019, 571: 311-321. DOI:10.1016/j.jhydrol.2019.02.005 |
| [12] |
Jin XL, Deng XL, Dai R et al. Analysis of the spatiotemporal distribution of algal blooms and its driving factors in Chaohu Lake based on multi-source datasets. Environmental Science, 2024, 45(5): 2694-2706. [金晓龙, 邓学良, 戴睿等. 基于多源数据的巢湖蓝藻水华时空分布及驱动因素分析. 环境科学, 2024, 45(5): 2694-2706. DOI:10.13227/j.hjkx.202306047] |
| [13] |
Na L, Zhou XS, Sun BW et al. Spatiotemporal variation of phytoplankton community and its relationship with environmental factors in the Lake Baiyangdian. J Lake Sci, 2020, 32(3): 772-783. [李娜, 周绪申, 孙博闻等. 白洋淀浮游植物群落的时空变化及其与环境因子的关系. 湖泊科学, 2020, 32(3): 772-783. DOI:10.18307/2020.0317] |
| [14] |
Jia J, Gao Y, Zhou F et al. Identifying the main drivers of change of phytoplankton community structure and gross primary productivity in a river-lake system. Journal of Hydrology, 2020, 583: 124633. DOI:10.1016/j.jhydrol.2020.124633 |
| [15] |
Jia HY, Xu JF, Lei JS. Relationship of community structure of phytoplankton and environmental factors in Danjiangkou Reservoir bay. Yangtze River, 2019, 50(5): 52-58. [贾海燕, 徐建锋, 雷俊山. 丹江口库湾浮游植物群落与环境因子关系研究. 人民长江, 2019, 50(5): 52-58.] |
| [16] |
Yang CT, Nan J, Li JH. Driving factors and dynamics of phytoplankton community and functional groups in an estuary reservoir in the Yangtze River, China. Water, 2019, 11(6): 1184. DOI:10.3390/w11061184 |
| [17] |
Chen S, Li YT, Cai WG et al. Variation characteristics of phytoplankton community in polyculture ponds of Scylla serrata and Penaeus monodon. South China Fisheries Science, 2020, 16(3): 79-85. [陈思, 李艺彤, 蔡文贵等. 虾蟹混养池塘浮游植物群落结构的变化特征. 南方水产科学, 2020, 16(3): 79-85. DOI:10.12131/20190233] |
| [18] |
Chang C, Gao L, Wei J et al. Spatial and environmental factors contributing to phytoplankton biogeography and biodiversity in mountain ponds across a large geographic area. Aquatic Ecology, 2021, 55(2): 721-735. DOI:10.1007/s10452-021-09857-2 |
| [19] |
Gong JL, Li XM, He YF et al. Relationship between plankton community structure and environmental factors in ecological cultrue ponds of black carp Mylopharyngodon piceus-Silver carp Hypophthalmichthys molitrix and bighead carp Aristichthys nobilis. Fisheries Science, 2022, 41(4): 517-526. [龚进玲, 李学梅, 何勇凤等. 青鱼—鲢、鳙生态池塘浮游生物群落结构特征及其与环境因子的关系. 水产科学, 2022, 41(4): 517-526.] |
| [20] |
Du SJ, Wang JY, Guo CX et al. Phytoplankton community characteristics and the underlying drivers under organic and conventional agricultural management. J Lake Sci, 2022, 34(6): 1828-1839. [杜少娟, 王吉毅, 国超旋等. 有机和常规农业管理方式下的浮游植物群落特征及其影响因素. 湖泊科学, 2022, 34(6): 1828-1839. DOI:10.18307/2022.0604] |
| [21] |
Zhang JL, Zheng BH, Liu DF et al. Succession pattern of phytoplankton of Daning River in the Three Gorges Reservoir and its driving factors. Environmental Science, 2017, 38(2): 535-546. [张佳磊, 郑丙辉, 刘德富等. 三峡水库大宁河支流浮游植物演变过程及其驱动因素. 环境科学, 2017, 38(2): 535-546. DOI:10.13227/j.hjkx.201606137] |
| [22] |
Yao L, Zhao X, Zhou GJ et al. Seasonal succession of phytoplankton functional groups and driving factors of cyanobacterial blooms in a subtropical reservoir in south china. Water, 2020, 12(4): 1167. DOI:10.3390/w12041167 |
| [23] |
Zhang M, Shi XL, Yang Z et al. Long-term dynamics and drivers of phytoplankton biomass in eutrophic Lake Taihu. Science of the Total Environment, 2018, 645: 876-886. DOI:10.1016/j.scitotenv.2018.07.220 |
| [24] |
Dong F, Zhou XJ, Zhang H et al. Plankton community structure and its relation to the environmental factors of Xiaoche River in Guiyang City. Genomics and Applied Biology, 2021, 40(Z1): 2127-2135. [董芳, 周贤君, 张辉等. 贵阳市小车河浮游生物群落结构与水环境因子的关系. 基因组学与应用生物学, 2021, 40(Z1): 2127-2135. DOI:10.13417/j.gab.040.002127] |
| [25] |
Zhang XY, Cai XP, Li Z et al. Characteristics of phytoplankton community stucture and water quality assessment in Ziya River of Tianjin. Journal of Hunan Ecological Science, 2022, 9(1): 70-76. [张新月, 蔡鑫鹏, 李曌等. 天津子牙河浮游植物群落结构特征及水质评价. 湖南生态科学学报, 2022, 9(1): 70-76. DOI:10.3969/j.issn.2095-7300.2022.01.010] |
| [26] |
Zhang M, Dong J, Gao YN et al. Patterns of phytoplankton community structure and diversity in aquaculture ponds, Henan, China. Aquaculture, 2021, 544: 737078. DOI:10.1016/j.aquaculture.2021.737078 |
| [27] |
Wen H, Cai JL, Su Y et al. Characteristics of periphytic algal community and its relationship with aquatic environmen-tal factors in streams of Lake Dianchi watershed in wet season. J Lake Sci, 2011, 23(1): 40-48. [文航, 蔡佳亮, 苏玉等. 滇池流域入湖河流丰水期着生藻类群落特征及其与水环境因子的关系. 湖泊科学, 2011, 23(1): 40-48. DOI:10.18307/2011.0107] |
| [28] |
Qian KM, Liu X, Chen YW. Spatial distribution characteristics of periphytic algae community of Lake Poyang in the high water level phase. J Lake Sci, 2021, 33(1): 102-110. [钱奎梅, 刘霞, 陈宇炜. 鄱阳湖丰水期着生藻类群落空间分布特征. 湖泊科学, 2021, 33(1): 102-110. DOI:10.18307/2021.0110] |
| [29] |
Fang LC, Ren YF, Bi YH et al. Responses of phytoplankton functional groups to water level fluctuations in the Xiangxi Bay, Three Gorges Reservoir. J Lake Sci, 2023, 35(5): 1538-1548. [方灵超, 任玉峰, 毕永红等. 三峡水库香溪河库湾浮游植物功能群对水位变化的响应. 湖泊科学, 2023, 35(5): 1538-1548. DOI:10.18307/2023.0513] |
| [30] |
Sutherland DL, Turnbull MH, Broady PA et al. Effects of two different nutrient loads on microalgal production, nutrient removal and photosynthetic efficiency in pilot-scale wastewater high rate algal ponds. Water Research, 2014, 66: 53-62. DOI:10.1016/j.watres.2014.08.010 |
| [31] |
Liu L, Hall G, Champagne P. The role of algae in the removal and inactivation of pathogenic indicator organisms in wastewater stabilization pond systems. Algal Research, 2020, 46: 101777. DOI:10.1016/j.algal.2019.101777 |
| [32] |
Xu ZM, Cui Z, Gao JF et al. Quantifying nitrogen and phosphorus loading from agricultural ponds in Lake Taihu Basin. Resources and Environment in the Yangtze Basin, 2022, 31(1): 148-155. [徐责茗, 崔桢, 高俊峰等. 太湖流域养殖池塘的氮磷污染负荷估算. 长江流域资源与环境, 2022, 31(1): 148-155. DOI:10.11870/cjlyzyyhj202201014] |
| [33] |
Huang JC, Cui Z, Tian F et al. Modeling nitrogen export from 2539 lowland artificial watersheds in Lake Taihu Basin, China: Insights from process-based modeling. Journal of Hydrology, 2020, 581: 124428. DOI:10.1016/j.jhydrol.2019.124428 |
| [34] |
Liu W, Tan QY, Chu YF et al. An integrated analysis of pond ecosystem around Poyang Lake: Assessment of water quality, sediment geochemistry, phytoplankton and benthic macroinvertebrates diversity and habitat condition. Aquatic Ecology, 2022, 56(3): 775-791. DOI:10.1007/s10452-021-09931-9 |
| [35] |
Chen WJ, He B, Nover D et al. Farm ponds in Southern China: Challenges and solutions for conserving a neglected wetland ecosystem. Science of the Total Environment, 2019, 659: 1322-1334. DOI:10.1016/j.scitotenv.2018.12.394 |
| [36] |
Huang JC, Gao JF, Yan RH. A Phosphorus Dynamic model for lowland Polder systems (PDP). Ecological Engineering, 2016, 88: 242-255. DOI:10.1016/j.ecoleng.2015.12.033 |
| [37] |
Huang JC, Zhang J, Ji YL et al. Thoughts on modelling and control of agricultural non-point source pollution in the lowland areas of Lake Taihu basin, China. Journal of Agro-Environment Science, 2022, 41(11): 2365-2370. [黄佳聪, 张京, 季雨来等. 太湖流域平原农业面源污染模拟与管控的思考. 农业环境科学学报, 2022, 41(11): 2365-2370. DOI:10.11654/jaes.2022-0545] |
| [38] |
中国科学院南京地理与湖泊研究所. 湖泊调查技术规程. 北京: 科学出版社, 2015.
|
| [39] |
胡鸿钧, 魏印心. 中国淡水藻类: 系统、生态及分类. 北京: 科学出版社, 2006.
|
| [40] |
Hillebrand H, Dürselen CD, Kirschtel D et al. Biovolume calculation for pelagic and benthic microalgae. Journal of Phycology, 1999, 35(2): 403-424. DOI:10.1046/j.1529-8817.1999.3520403.x |
| [41] |
Padisák J, Borics G, Grigorszky I et al. Use of phytoplankton assemblages for monitoring ecological status of lakes within the water framework directive: The assemblage index. Hydrobiologia, 2006, 553(1): 1-14. DOI:10.1007/s10750-005-1393-9 |
| [42] |
Spearman rank correlation coefficient. The concise encyclopedia of statistics. New York: Springer, 2008: 502-505.
|
| [43] |
Liao N, Li H, Zhang LL et al. Coupled effects of environmental conditions on the spatio-temporal variability of phytoplankton in canyon-shaped reservoirs. Journal of Cleaner Production, 2023, 386: 135797. DOI:10.1016/j.jclepro.2022.135797 |
| [44] |
Wu ZS, Wang F, Wang XL et al. Water quality assessment using phytoplankton functional groups in the middle-lower Changjiang River, China. Limnologica, 2023, 99: 126056. DOI:10.1016/j.limno.2023.126056 |
| [45] |
Colombetti G, Lenci F, Diehn B. Responses to photic, chemical, and mechanical stimuli. Physiology. Amsterdam: Elsevier, 1982: 169-195. DOI: 10.1016/b978-0-12-139903-0.50012-3.
|
| [46] |
Feregrino-Mondragón RD, Vega-Segura A, Sánchez-Thomas R et al. The essential role of mitochondria in the consumption of waste-organic matter and production of metabolites of biotechnological interest in Euglena gracilis. Algal Research, 2021, 56: 102302. DOI:10.1016/j.algal.2021.102302 |
| [47] |
Lee RE. Phycology. Cambridge: Cambridge University Press, 2008.
|
| [48] |
Reynolds CS, Huszar V, Kruk C et al. Towards a functional classification of the freshwater phytoplankton. Journal of Plankton Research, 2002, 24(5): 417-428. DOI:10.1093/plankt/24.5.417 |
| [49] |
Hu R, Lan YQ, Xiao LJ et al. The concepts, classification and application of freshwater phytoplankton functional groups. J Lake Sci, 2015, 27(1): 11-23. [胡韧, 蓝于倩, 肖利娟等. 淡水浮游植物功能群的概念、划分方法和应用. 湖泊科学, 2015, 27(1): 11-23. DOI:10.18307/2015.0102] |
| [50] |
An R, Wang FY, Yu HX et al. Characteristics and physical factors of phytoplankton functional groups in Small Xingkai Lake. Research of Environmental Sciences, 2016, 29(7): 985-994. [安睿, 王凤友, 于洪贤等. 小兴凯湖浮游植物功能群特征及其影响因子. 环境科学研究, 2016, 29(7): 985-994. DOI:10.13198/j.issn.1001-6929.2016.07.06] |
| [51] |
Yan SS, Lei B, Liu SR et al. Seasonal variation of phytoplankton functional groups in Changshou Lake and rlevant environmental factors. Journal of Hydroecology, 2018, 39(3): 52-60. [闫苏苏, 雷波, 刘朔孺等. 长寿湖浮游植物功能群季节变化及影响因子. 水生态学杂志, 2018, 39(3): 52-60. DOI:10.15928/j.1674-3075.2018.03.008] |
| [52] |
Cha Y, Cho KH, Lee H et al. The relative importance of water temperature and residence time in predicting cyanobacteria abundance in regulated rivers. Water Research, 2017, 124: 11-19. DOI:10.1016/j.watres.2017.07.040 |
| [53] |
Reynolds CS. Variability in the provision and function of mucilage in phytoplankton: Facultative responses to the environment. Hydrobiologia, 2007, 578(1): 37-45. DOI:10.1007/s10750-006-0431-6 |
| [54] |
Wang F, Li YJ, Ma TT et al. Ecological health assessment of urban lake based on phytoplankton—A case study of Lake Xihu, Tongling, lower reaches of the Yangtze River. J Lake Sci, 2022, 34(6): 1890-1900. [王芳, 李永吉, 马廷婷等. 基于浮游植物的城市湖泊生态健康评价——以长江下游铜陵市西湖为例. 湖泊科学, 2022, 34(6): 1890-1900. DOI:10.18307/2022.0628] |
| [55] |
Kim JH, Lee DH, Kang JH. Associating the spatial properties of a watershed with downstream Chl.a concentration using spatial analysis and generalized additive models. Water Research, 2019, 154: 387-401. DOI:10.1016/j.watres.2019.02.010 |
| [56] |
Nalewajko C, Murphy TP. Effects of temperature, and availability of nitrogen and phosphorus on the abundance of Anabaena and Microcystis in Lake Biwa, Japan: An experimental approach. Limnology, 2001, 2(1): 45-48. DOI:10.1007/s102010170015 |
| [57] |
Reynolds CS. Ecology of phytoplankton. Cambridge: Cambridge University Press, 2006.
|
| [58] |
Steel A. Book reviews. European Journal of Phycology, 1998, 33(1): 93-94. DOI:10.1080/09670269810001736583 |
| [59] |
Zhu KX, Bi YH, Hu ZY. Responses of phytoplankton functional groups to the hydrologic regime in the Daning River, a tributary of Three Gorges Reservoir, China. Science of the Total Environment, 2013, 450/451: 169-177. DOI:10.1016/j.scitotenv.2013.01.101 |
| [60] |
Xiong LL, Fang SW, Li KY et al. Temporal distribution patterns of phytoplankton and their drivers in Lake Poyang (China)—A monthly study from 2011 to 2019. Ecological Indicators, 2021, 133: 108435. DOI:10.1016/j.ecolind.2021.108435 |
 2024, Vol. 36


