(2: 中国科学院精密测量科学与技术创新研究院, 环境与灾害监测评估湖北省重点实验室, 武汉 430071)
(3: 中国科学院大学, 北京 100049)
(2: Key Laboratory for Environment and Disaster Monitoring and Evaluation, Hubei, Innovation Academy for Precision Measurement Science and Technology, Wuhan 430071, P. R. China)
(3: University of Chinese Academy of Sciences, Beijing 100049, P. R. China)
鄱阳湖是亚热带季风气候的季节性吞吐湖泊,受流域来水和长江共同作用,江湖关系复杂,水文节律特殊,长期以来形成了独特而脆弱的湿地生态系统[1-2]。该区域历来是干旱及洪水频发的地域,而未来的极端天气和气候事件在持续时间、严重程度和发生频率上可能会进一步延长和加剧[3]。2022年,鄱阳湖流域出现自1951年有记录以来最早进入枯水期的年份,干旱严重[4-6]。在干旱过程中,湖区植被和藻类生长会受到影响,大量鱼虾搁浅死亡,鸟类的觅食栖息地减少,对鸟类生态和湖泊生态造成严重损害[7]。同时,鄱阳湖湿地面积减少,涵养水源、调节气候等生态功能下降,对气候和生态环境产生直接影响[8]。
干旱作为影响因子最复杂、监测最为困难的灾害类型之一,时空变异大,影响范围广[9]。以往鄱阳湖湿地干旱研究主要集中在两个方面:一是利用水文数据与水动力模型模拟并量化水利工程对干旱的缓解作用;二是利用气象数据与遥感影像构建水文干旱指数,进行干旱时空变化特征与趋势分析以及干旱驱动因素分析[10-15]。鄱阳湖湖盆地形平坦,湿地结构复杂,植被对水位波动响应敏感[16],干旱往往引起地表状况发生快速变化。获取持续的干旱变化及其生态影响过程信息依赖于高时空分辨率的数据。然而,在干旱监测中常用的高时间分辨率遥感影像,如MODIS等,其空间分辨率通常较低(250~1000 m);而高空间分辨率影像往往缺少时间上的连续性,即便近年的Sentinel-2影像,时间重访周期为5天,但受天气等因素影响,数据分布不均匀,难以反映逐季度甚至逐月的变化。时空信息融合模型可以有效弥补影像时空分辨率不足的问题[17],其通过融合一对t1时刻的粗分辨率影像(MODIS)和细分辨率影像(Sentinel-2)以及t2时刻的粗分辨率影像预测缺失的t2时刻细分辨率影像,得到新的高时空分辨率影像序列。目前,时空信息融合模型在水体变化监测[18]、水体边界提取[19]、森林树种分类[20]、土地利用监测[21]等多个领域已得到广泛应用。
因此,本研究拟采用时空信息融合模型,融合MODIS和Sentinel-2影像数据,获取鄱阳湖2021—2022年高时空分辨率数据序列,对比分析2022年干旱变化过程及其植被响应。相关研究表明,不同的生态系统在不同的时间尺度上对持续缺水的反应有所不同[22-23],依赖于高空间分辨率数据衍生的指数如归一化植被指数(NDVI)在湿地干旱监测的准确率更高[24]。在水分胁迫条件下,植物和光合活性降低导致NDVI值降低,长期监测NDVI可以深入了解植被生长状况和干旱引起的变化[25-26]。因此,本文在遥感数据时空信息融合基础上,通过对比不同年份水体面积变化以及NDVI时空变化,分析湿地植被对干旱的响应过程及干旱对湖区造成的生态影响。
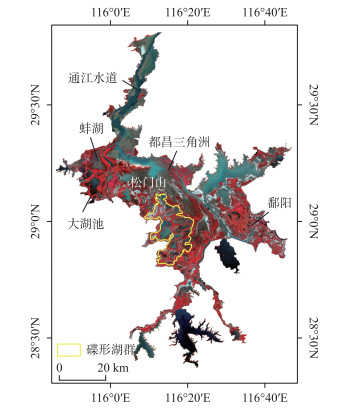
1 研究区概况与数据方法 1.1 研究区介绍鄱阳湖(28°22′~29°45′N, 115°47′~116°45′E, 图 1)位于江西省北部,是中国最大的淡水湖泊。鄱阳湖流域处于亚热带暖湿季风气候区,湖水年均温在18 ℃左右,年均降水量为1400~1900 mm,水体面积季节性变化显著[27]。雨季(4—9月)洲滩往往被完全淹没,湖泊水域面积超过3000 km2。旱季(10月到次年3月),水域面积缩小至不足1000 km2[28]。雨季的洪水脉冲为鄱阳湖带来养分和有机物,旱季的退水为众多水鸟提供了丰富的觅食区,吸引了每年约162种越冬水鸟来此栖息[29]。其中包括占全球估计数量超过98%的极度濒危白鹤、占全球估计数量超过90%的濒危东方白鹳等[30]。鄱阳湖区湿地植被主要由草本植物组成[31],其中主要植被群落有苔草(Carex spp.)、虉草(Phalaris arundinacea)、蓼子草(Polygonum criopolitanum)、芦苇(Phragmites australis)、南荻(Triarrhena lutarioriparia)、狗牙根(Cynodon dactylon)等[32]。
|
图 1 研究区概况(影像获取时间:2022年8月11日) Fig.1 Location of the study area (Acquisition time: August 11, 2022) |
本文使用的数据源主要包括MODIS和Sentinel-2 NDVI影像数据。所有数据均通过Google Earth Engine (GEE)云平台(https://earthengine.google.com/)筛选合适影像,并计算NDVI后下载。GEE平台上的数据集名称分别为MOD09Q1.061 Terra Surface Reflectance 8-Day Global 250 m(MOD09Q1)、Harmonized Sentinel-2 Multi-Spectral Instrument Level-2A (COPERNICUS/S2_SR_HARMONIZED)。以上所有数据均经过大气校正和辐射定标处理,并已筛选过滤掉无效数据。Sentinel-2选取2021年有效影像19期,2022年有效影像20期,但数据年内分布不均匀,多集中在9—10月份。MODIS选取2021年有效影像25期,2022年有效影像22期,均重采样为10 m分辨率。
1.3 研究方法 1.3.1 STNLFFM时空信息融合算法现今时空信息融合模型已发展出许多代表性的算法,如基于动态加权思想的算法(enhanced spatial and temporal adaptive reflectance fusion model,ESTARFM)[33]以及基于加权、混合像元分解和空间插值等多种方法的算法(flexible spatiotemporal data fusion,FSDAF)[34]等。本文通过前期比较分析,发现基于时空非局部滤波的融合模型(spatial and temporal nonlocal filter-based fusion model,STNLFFM)[35]在地表覆盖变化较大的区域有较好的融合性能,能较好地适用于鄱阳湖湿地区域[36]。
STNLFFM算法假设均匀分布的粗分辨率像素在t1~tp时间段内线性变化,然后将此线性变化应用到细分辨率像素上,从而预测出理想状态下tp时刻的细分辨率影像。在计算过程中,STNLFFM算法提高了相似像元的选择精度,不仅引入了局部移动窗口Ω寻找相似像元(xi,yj),还结合非局部相似像元一起得到预测日期的未知像元。比如鄱阳湖湿地的水体像元不仅在邻域范围上有相似性,在其他地理位置上的像元仍然具有相似性,这类像元被称为非局部相似像元。因此,该算法在线性关系的基础上增加了新的权重计算函数W,从而最终得到预测影像F(xi,yj,tp),计算公式为:
| F(xi,yj,tp)=K∑k=1N∑n=1W1(xi,yj,tk)×Wf[a(xi,yj,Δtk)×F(xi,yj,tk)+b(xi,yj,Δtk)] | (1) |
式中,K为输入的粗细分辨率影像总对数(2对);N为包括预测像元在内的相似像元数;(xi, yj)为相似像元所在位置,a(xi, yj, Δtk)和b(xi, yj, Δtk)分别为第k对粗分辨率影像在局部窗口Ω内求得的线性回归模型系数,局部窗口Ω大小设为51像元;Wl(xi, yj, tk)为已知时刻各相似像元对中心像元的个体权重;Wf为各输入影像对预测结果的综合权重。
1.3.2 精度验证方法如以同期Sentinel-2高分辨率影像为参考,算法融合后的预测影像应较原始MODIS影像与参考影像具有更高的相似性,因此本文通过比较预测影像与原始MODIS影像以及预测影像与同期Sentinel-2高分辨率影像之间的相关性和决定系数R2,来验证融合算法结果精度。
| R2=1−n∑i=1(ci−fi)2n∑i=1(ci−ˉc)2 | (2) |
式中,i为当前影像,n为影像总期数,ci是实际值,fi是预测值,c是实际值的平均值。
1.3.3 水体与洲滩划分本文通过阈值法对鄱阳湖湿地NDVI影像数据进行水体与洲滩的划分,阈值一般设为0.1左右[37]。水体和周边环境的光谱差异往往随时间发生变化,导致用于水体划分的植被指数阈值也会发生小的波动。湿地地区因水体波动等因素的影响,春、冬季的阈值划分一般要略小于夏、秋季[37]。为精确划分水体与洲滩,本文根据多光谱合成数据对阈值进行微调。阈值具体设置见表 1。
| 表 1 水体与洲滩NDVI阈值划分 Tab. 1 Threshold division of water bodies and floodplains based on NDVI |
通过阈值法划分出每一期影像的水体与洲滩,并二值化标记出每张影像的所有像素信息,然后计算出水体的停留时间即为洲滩淹没时长Tsum。计算公式为:
| Tsum =n∑i=1decimali{0( 水体 )1( 洲滩 )×ti−ti−1|(t0−0) | (3) |
式中,decimali为第i期影像的二值化信息,ti为当前影像对应的日序数,ti-1为上一张影像的日序数。
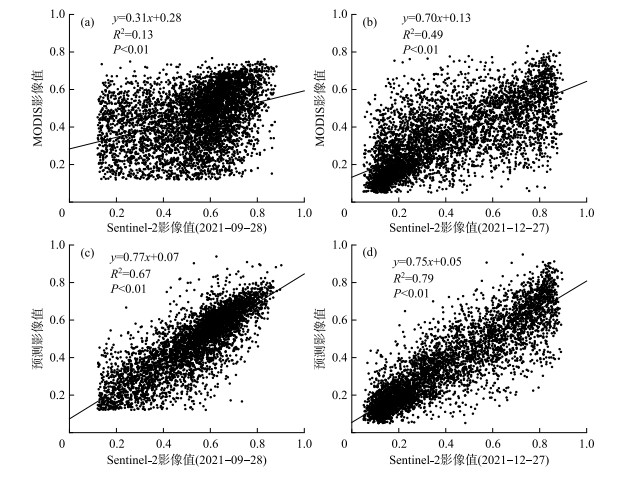
2 结果分析 2.1 STNLFFM算法融合结果与评价因湿地水体对洲滩的影响较大,为检验STNLFFM算法的有效性与鲁棒性,本文挑选2021年平水期(9月)和枯水期(12月)2组水体面积变化相差较大时期的影像进行实验,通过阈值法去除水体后,随机选取5000个像素点进行相关性验证,如图 2所示。
|
图 2 Sentinel-2影像与MODIS影像和预测影像散点图 Fig.2 Scatter plot of Sentinel-2 image and MODIS and predicted images |
通过对比发现,第1组平水期实验中原始粗分辨率的MODIS影像与细分辨率的Sentinel-2影像的相关性较弱,而经过融合预测得到的细分辨率影像与Sentinel-2影像之间的相关性有较大提升,拟合趋势线斜率从0.31(图 2a)提高到0.77(图 2c),R2从0.13提高到0.67;第2组枯水期实验与细分辨率影像的相关性同样有一定的提升,拟合趋势线斜率从0.70(图 2b)提高到0.75(图 2d),R2从0.49提高到0.79。最终,经STNLFFM模型时空融合,本文获取了空间分辨率为10 m的2021—2022年NDVI影像序列。研究时段中可用影像数量从原来的39期增加到共56期,基本保证每个月拥有2期高分辨率影像。
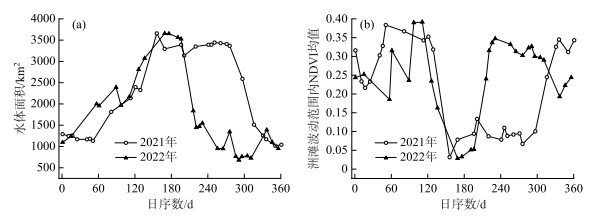
2.2 鄱阳湖水体面积及洲滩NDVI均值年内变化特征为衡量洲滩及植被的动态变化,本文统计了2021年和2022年的水体面积和枯水期最大洲滩面积内NDVI均值,得到各年份水体面积和洲滩波动范围内的NDVI均值(去除水体后)变化曲线(图 3)。
|
图 3 鄱阳湖湿地水体面积变化曲线(a)和洲滩波动范围内NDVI均值曲线(b) Fig.3 Changes curve of water area (a) and NDVI mean curve (b) within the fluctuation range of the floodplain in Lake Poyang |
由图 3a可知,2021年和2022年的水体面积都呈现出先增加后减小的变化趋势,年内最大水体面积均在3600 km2左右。其中,2022年7月中旬水体面积开始减小,较2021年提前约80天;2022年10月鄱阳湖最小水体面积为680 km2,较2021年同期减少约1900 km2,较2021年枯水期最小水体面积减少约337 km2。由图 3b可知,2021年洲滩波动范围内的NDVI均值曲线呈现出两个NDVI上升期,表明湖区植被在春季和秋季大致呈现出两个生长期;2022年洲滩波动范围内的NDVI均值从1月开始增加,到4月中旬到达峰值后下降,7月中旬再次升高。其中,在7—8月之间,2022年NDVI均值较2021年同期均值最大高0.27。综上可知,鄱阳湖从2022年7—8月之间提前开始退水,洲滩植被提前开始生长,NDVI均值迅速升高,在8月上旬到达第2个峰值后,洲滩NDVI均值再次降低。
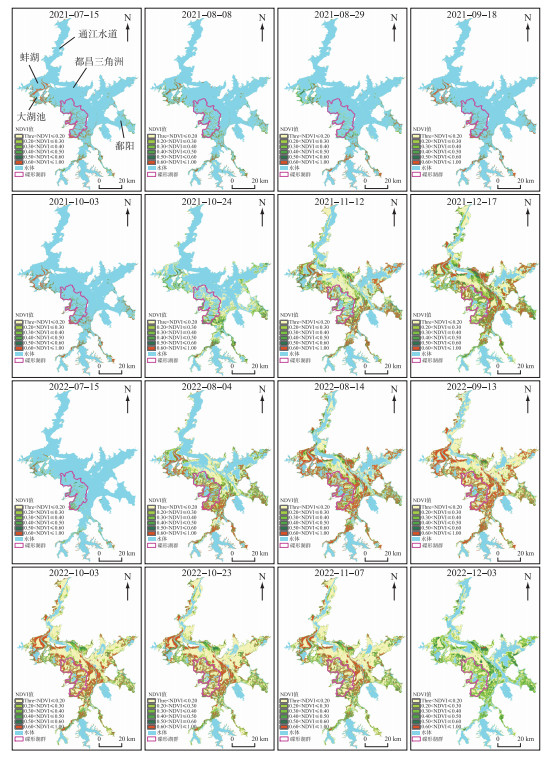
2.3 年内洲滩不同NDVI区间的空间分布研究表明NDVI值≤0.10对应岩石、沙子或雪的贫瘠地区,NDVI值为0.20~0.30代表稀疏的灌丛或草地,灌木、草原等植被或衰老作物可能会产生适中的NDVI值(0.20~0.50),高值(0.60~0.80)代表浓密的植被[38]。为观察鄱阳湖洲滩区域NDVI值相同的不同时期的面积变化过程,并结合表 1阈值划分(阈值点记为Thre),本文将按照Thre<NDVI≤0.20、0.20<NDVI≤0.30、0.30<NDVI≤0.40、0.40<NDVI≤0.50、0.50<NDVI≤0.60和0.60<NDVI≤1.00将NDVI分为6个区间,分析不同时期的各区间NDVI值的空间变化。为探讨干旱对鄱阳湖植被空间分布范围的影响,重点分析7—12月的NDVI影像, 如图 4所示。
|
图 4 2021—2022年鄱阳湖湿地不同区间NDVI空间分布 Fig.4 Spatial distribution of NDVI in different intervals of Lake Poyang floodplain during 2021-2022 |
2021年7月15日—10月24日,蚌湖、大湖池和碟形湖群附近的NDVI值在0.6左右波动频繁;2021年11月12日鄱阳湖水体面积减小,植被从周边区域开始向湖心生长,都昌三角洲植被生长较快;2021年12月17日NDVI值大于0.6的区域广泛分布在蚌湖、都昌三角洲以及湖心。2022年7月15日—8月4日期间,鄱阳湖退水开始,水体面积提前达2021年11月水平,且碟形湖群周边区域0.20<NDVI≤0.30与0.30<NDVI≤0.40区间分布紧密,呈环带状;2022年8月14日大部分区间NDVI值的分布情况与2021年12月17日影像相似;到2022年11月7日,NDVI<0.2的区域广泛分布于研究区;2022年12月3日大部分地区植被NDVI>0.6,仅有少量NDVI>0.6的区域分布在都昌三角洲。
2.4 年内洲滩不同NDVI区间的面积变化为进一步定量分析洲滩区域在干旱条件下的整体变化趋势,本文统计出2021—2022年洲滩不同NDVI区间的面积并对比分析了两年间的面积变化过程。
由图 5可见,2021年与2022年不同NDVI区间面积随时间变化的曲线总体均呈现出“凹”字形。其中,区间NDVI<0.2与NDVI>0.6的面积均波动较大。2022年NDVI>0.6的面积维持在800 km2的时长仅为1个月,较2021年减少2个月左右。2022年5月中旬—7月中旬,所有区间面积稳定在100 km2左右;2021年6—9月,所有区间的面积都稳定在200 km2左右。从2022年7月中旬开始,所有NDVI区间面积均再次增加,较2021年提前近3个月,NDVI<0.2和>0.6的区间面积同步增加且增速较快。2022年11月中旬NDVI<0.2的面积为1527 km2,较2021年同期增加了561 km2;2022年12月NDVI>0.6的区间面积仅约15 km2,较2021年同期减少约700 km2。

|
图 5 2021和2022年鄱阳湖洲滩不同NDVI区间所占面积变化曲线 Fig.5 Area change curve of NDVI in different intervals of Lake Poyang floodplain in 2021 and 2022 |
本文通过阈值法划分每一期影像的水体与洲滩后,根据公式(3)计算出洲滩淹水时长并统计面积信息。由表 2可见,受干旱影响,2022年淹水时长小于90天的面积约为1176 km2,约占鄱阳湖总面积的30.77%,而2021年仅占10.07%。由图 6可见,2022年淹水较长的区域与2021年相似,主要包括通江水道和受人为调控的水库。鄱阳湖区2022年仍存在一定数量淹水时长大于270天的碟形子湖,但数量相较于2021年有所减少,如象湖、大伍湖、西湖、太阳湖等在2022年淹水时长不足180天。淹水时长在2年间相差较大的区域主要分布在蚌湖、碟形湖群、都昌三角洲以及鄱阳等周边。
| 表 2 鄱阳湖洲滩淹水时长统计 Tab. 2 Days of water duration in Lake Poyang floodplain |
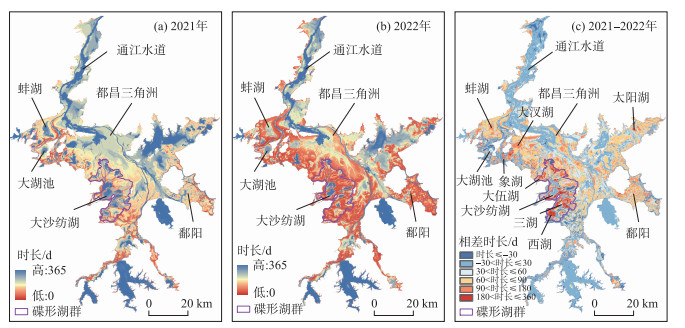
|
图 6 2021—2022年鄱阳湖洲滩淹水时长影像对比 Fig.6 The submergence duration of Lake Poyang floodplain during 2021-2022 |
通常鄱阳湖每年10月前后开始退水,适宜鸟类觅食的草洲逐渐显露,11月份候鸟开始迁入,到12月—次年1月,候鸟数量逐渐达到峰值[39]。本文研究结果显示,2022年鄱阳湖提前80天左右进入枯水期,10月水体达最小面积,较2021年同期减少约1900 km2。2022年干旱引起的水文节律及植被变化,将极大改变候鸟的栖息环境。相关研究表明,NDVI与食草性候鸟数量呈强相关[40],其中鸿雁(Anser cygnoides)等食草性鸟类更倾向选择NDVI<0.5的新长草地区觅食[41]。2022年,由于鄱阳湖提前退水,草洲提前显露。到11月湖区NDVI<0.5的面积远大于2021年同期,一定程度上有利于食草性鸟类的觅食。据报道,2022年10月28日鄱阳湖监测到58种候鸟,共22万只,其中以食草性为主的雁形目候鸟最多,约16万只。候鸟总数较2021年同期多10万余只,种类多3种[42]。此外,鄱阳湖地区一年两季生长的湿地植被易受水体变化影响[43],2022年提前退水虽初期有利于植被生长,但土壤养分提前消耗,一些适应力较差的植被提前枯萎或休眠[30]。由本文数据可见,干旱近80天后,湖区NDVI值为0.5~0.6和大于0.6的面积均呈下降趋势,导致洲滩整体NDVI均值下降。持续的干旱使泥滩基质表面干燥,块茎发育变缓、数量减少[44],阻碍了食块茎鸟类如西伯利亚鹤(Grus leucogeranus)和白枕鹤(G. vipio)的正常觅食[45]。鉴于鄱阳湖干旱植被提前发育的特征及其对候鸟觅食的影响,应适当对蚌湖、都昌三角洲以及碟形湖群长势迅速的植被进行刈割,促使新芽萌发,保障候鸟的食源。
2022年鄱阳湖干旱与往期干旱不同,生态影响也存在差异。2011年鄱阳湖区同样发生干旱,且干旱持续时长与2022年相近。然而,2011年干旱发生在1—5月,枯水期较2022年夏季干旱提前约2个月,湖区沉水植被萌发的嫩芽和湖底鱼苗因缺水而大量死亡[46]。2022年鄱阳湖干旱发生于7—11月。其中7—8月水体面积的快速减小造成江豚被困,相关保护单位在松门山南北砂坑(群)集中捕捞迁出约200头江豚[47-48]。鉴于干旱会导致连续湖面被快速分解成多个非连通水体,本文建议应综合运用卫星遥感、无人机监测等多种手段,开展高时空分辨率的水体连续变化过程监测和预测,重点关注水体连通状况及其变化趋势,从而有针对性地开展非连通水域被困水生生物的救助工作[48]。
3.2 碟形湖泊的持水作用鄱阳湖湿地大约有102个大小不一的碟形湖泊[49],丰水期被湖水淹没,枯水期与湖水断连,形成独立子湖,在极端干旱条件下碟形湖泊具有减缓地下水消耗与保护生态栖息地的重要作用[50]。本研究中统计了碟形湖群(图 1中黄色区域)与碟形湖群周边区域的水体面积占比,发现碟形湖群在退水期间的水体面积变化幅度相较于碟形湖群周边区域更小。如图 7所示,在2022年8月中旬,在碟形湖群周边区域水体面积占比几乎为0的情况下,碟形湖群的水体面积占比达20%以上。据本文统计,在2022年的夏季干旱过程中,三湖、大沙坊湖等碟形湖淹水时长在270天以上。相关研究表明,碟形湖泊发育的草甸比自由连通的湖泊中发育的草甸对异常变化水位的抵抗力更高[49, 51],该现象与本文结果一致。如图 4所示,相比都昌三角洲等洲滩,碟形湖群的植被NDVI变化相对较小。因此,本文建议加强碟形子湖微地貌及其空间结构的保护和优化,进一步保障碟形湖的持水能力,维修破损的碟形湖湖堤,并在干旱期间考虑适度补水,以保持碟形湖湿地生态系统的稳定性。
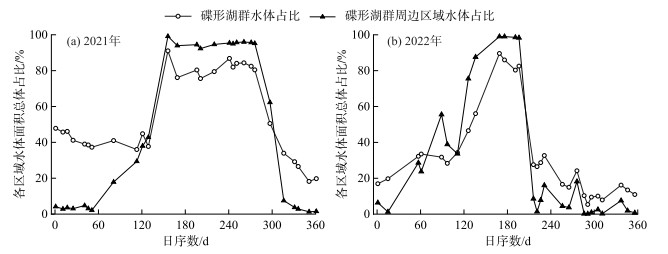
|
图 7 2021—2022年碟形湖群与碟形湖周边区域水体面积占比曲线 Fig.7 Water area ratio curves between Poyang sub-lakes and the surrounding area during 2021-2022 |
融合算法虽在一定程度上缓解了时空分辨率不足的矛盾,但更复杂的景观格局会给时空预测带来更高的不确定性[11],在鄱阳湖湿地这类水陆转换复杂、地表差异波动较大的特殊地区需要适应性更强的算法。STNLFFM算法使用两个回归系数来描述土地覆盖变化信息,提高了对复杂变化景观的预测能力[33],在鄱阳湖地区有较好的适用性。其次,影像时间间隔亦会影响算法的选择。一般时间间隔越短,预测效果越好,但当平均时间间隔大于90天时,不同算法之间的预测精度波动较小[33-35]。本文对比2021—2022年融合影像发现,不同年份同一时期的影像可能会有较大差别,年内影像融合比年际影像融合更准确。同时,适当增加输入粗细分辨率影像对也可提高预测精度。此外,融合影像之间空间分辨率差异越大,融合误差越明显[31]。除STNLFFM算法外,如今新发展出的STAFFN算法[52]和改进的ESTARFM算法[53]等在湖泊面积变化中的应用也可为该研究提供参考,但二者在更高空间分辨率以及季节动态或月度动态上的融合潜力有待继续研究[54]。
4 结论本文从不同NDVI区间的空间分布、水体面积和不同NDVI区间面积的变化以及洲滩淹水时长等方面,对2022年鄱阳湖干旱变化过程及其造成的影响进行分析,得到以下结论:
1) 2022年涨水时间比2021年提前约45天,退水时间比2021年提前约80天;2022年10月鄱阳湖最小水体面积为680 km2,较2021年同期减少约1900 km2,较2021年枯水期最小水体面积减少约337 km2。2022年鄱阳湖全年淹水时长小于90天的面积是2021年的3倍以上,约占总面积的30.77%。
2) 2022年鄱阳湖干旱导致7月洲滩NDVI均值迅速增大,较2021年同期均值最大高0.27。到11月中旬,2022年NDVI值小于0.2的面积为1527 km2,较2021年同期增加了561 km2;NDVI值大于0.6的面积在8月中旬再次减小,较2021年提前2个月左右,到12月面积仅为15 km2,不足2021年同期的3%。
3) 2022年干旱引起的水文节律及植被变化改变了候鸟及长江江豚的栖息环境。湖区的碟形子湖具有较好的持水能力,对极端干旱具有较好的抵御作用。
4) 时空信息融合算法STNLFFM在鄱阳湖地区有较强的适用性。融合得到的鄱阳湖2021—2022年10 m高时空分辨率NDVI影像序列,数量上从原有的39期增加到56期,空间上保留的更多细节有助于更加精细地分析干旱变化过程。
| [1] |
Qi LY, Huang JC, Huang Q et al. Assessing aquatic ecological health for Lake Poyang, China: Part Ⅱ index application. Water, 2018, 10(7): 909. DOI:10.3390/w10070909 |
| [2] |
You HL, Fan HX, Xu LG et al. Poyang lake wetland ecosystem health assessment of using the wetland landscape classification characteristics. Water, 2019, 11(4): 825. DOI:10.3390/w11040825 |
| [3] |
Yao N, Li Y, Li N et al. Bias correction of precipitation data and its effects on aridity and drought assessment in China over 1961-2015. Science of the Total Environment, 2018, 639: 1015-1027. DOI:10.1016/j.scitotenv.2018.05.243 |
| [4] |
Cao SJ, Li YL, Chen J et al. Influence of extreme drought in 2022 on groundwater hydrological regime in the Poyang Lake floodplain area. China Environmental Science, 2023, 43(12): 6601-6610. [曹思佳, 李云良, 陈静等. 2022年鄱阳湖极端干旱对洪泛区地下水文情势的影响. 中国环境科学, 2023, 43(12): 6601-6610.] |
| [5] |
Jia JW, Wang D, Xu WF et al. Comprehensive evaluation and cause analysis of drought in Poyang Lake Basin in 2022. Yangtze River, 2023, 54(2): 36-42. [贾建伟, 王栋, 徐伟峰等. 2022年鄱阳湖流域干旱综合评估及成因分析. 人民长江, 2023, 54(2): 36-42.] |
| [6] |
Lei S, Shi S, Qu YP et al. Characteristics of extreme drought in the Poyang Lake Basin in 2022 and implications for future response. Journal of Hydraulic Engineering, 2023, 54(3): 333-346. [雷声, 石莎, 屈艳萍等. 2022年鄱阳湖流域特大干旱特征及未来应对启示. 水利学报, 2023, 54(3): 333-346.] |
| [7] |
Qian KM, Liu X, Chen YW. Effect of hydrological variability on diatom distribution in Poyang Lake, China. Chinese Journal of Oceanology and Limnology, 2017, 35(1): 174-184. DOI:10.1007/s00343-016-5264-1 |
| [8] |
Cao CX, Zhao J, Gong P et al. Wetland changes and droughts in southwestern China. Geomatics, Natural Hazards and Risk, 2012, 3(1): 79-95. DOI:10.1080/19475705.2011.588253 |
| [9] |
Ault TR. On the essentials of drought in a changing climate. Science, 2020, 368(6488): 256-260. DOI:10.1126/science.aaz5492 |
| [10] |
Yao J, Zhang Q, Ye XC et al. Quantifying the impact of bathymetric changes on the hydrological regimes in a large floodplain lake: Poyang Lake. Journal of Hydrology, 2018, 561: 711-723. DOI:10.1016/j.jhydrol.2018.04.035 |
| [11] |
Xue CY, Zhang Q, Jia YX et al. Intensifying drought of Poyang Lake and potential recovery approaches in the dammed middle Yangtze River catchment. Journal of Hydrology: Regional Studies, 2023, 50: 101548. DOI:10.1016/j.ejrh.2023.101548 |
| [12] |
Li XH, Zhang Q, Zhang D et al. Investigation of the drought-flood abrupt alternation of streamflow in Poyang Lake catchment during the last 50 years. Hydrology Research, 2017, 48(5): 1402-1417. DOI:10.2166/nh.2016.266 |
| [13] |
Xie K, Ding MJ, Zhang HM et al. Spatiotemporal variation of drought in Poyang Lake Basin in recent sixty years based on SPEl. Resources and Environment in the Yangtze Basin, 2021, 30(8): 2015-2027. [谢坤, 丁明军, 张华敏等. 基于SPEI指数的鄱阳湖流域近60 a干旱时空变化特征. 长江流域资源与环境, 2021, 30(8): 2015-2027. DOI:10.11870/cjlyzyyhj202108022] |
| [14] |
Liu WL, Zhu SN, Huang YP et al. Spatiotemporal variations of drought and their teleconnections with large-scale climate indices over the Poyang Lake basin, China. Sustainability, 2020, 12(9): 3526. DOI:10.3390/su12093526 |
| [15] |
Lai XJ, Shankman D, Huber C et al. Sand mining and increasing Poyang Lake's discharge ability: A reassessment of causes for lake decline in China. Journal of Hydrology, 2014, 519: 1698-1706. DOI:10.1016/j.jhydrol.2014.09.058 |
| [16] |
Dai X, Wan RR, Yang GS et al. Impact of seasonal water-level fluctuations on autumn vegetation in Poyang Lake wetland, China. Frontiers of Earth Science, 2019, 13(2): 398-409. DOI:10.1007/s11707-018-0731-y |
| [17] |
Chen B, Huang B, Xu B. Comparison of spatiotemporal fusion models: A review. Remote Sensing, 2015, 7(2): 1798-1835. DOI:10.3390/rs70201798 |
| [18] |
Ye XC, Wu J, Li XH et al. Multi-source remote sensing data and image fusion technology reveal significant spatiotemporal heterogeneity of inundation dynamics in a typical large floodplain lake system. Journal of Hydrology: Regional Studies, 2023, 50: 101541. DOI:10.1016/j.ejrh.2023.101541 |
| [19] |
Wang ZY, Liu XY, Li W et al. Temporal and spatial variation analysis of lake area based on the ESTARFM model: A case study of Qilu Lake in Yunnan Province, China. Water, 2023, 15(10): 1800. DOI:10.3390/w15101800 |
| [20] |
Cui L, Chen SB, Mu YL et al. Tree species classification over cloudy mountainous regions by spatiotemporal fusion and ensemble classifier. Forests, 2023, 14(1): 107. DOI:10.3390/f14010107 |
| [21] |
Lu YT, Wu PH, Ma XS et al. Detection and prediction of land use/land cover change using spatiotemporal data fusion and the Cellular Automata-Markov model. Environmental Monitoring and Assessment, 2019, 191(2): 68. DOI:10.1007/s10661-019-7200-2 |
| [22] |
Ding YB, He XF, Zhou ZQ et al. Response of vegetation to drought and yield monitoring based on NDVI and SIF. CATENA, 2022, 219: 106328. DOI:10.1016/j.catena.2022.106328 |
| [23] |
Xu HJ, Wang XP, Zhao CY et al. Diverse responses of vegetation growth to meteorological drought across climate zones and land biomes in northern China from 1981 to 2014. Agricultural and Forest Meteorology, 2018, 262: 1-13. DOI:10.1016/j.agrformet.2018.06.027 |
| [24] |
Varghese D, Radulović M, Stojković S et al. Reviewing the potential of sentinel-2 in assessing the drought. Remote Sensing, 2021, 13(17): 3355. DOI:10.3390/rs13173355 |
| [25] |
White JG, Sparrius J, Robinson T et al. Can NDVI identify drought refugia for mammals and birds in mesic landscapes?. Science of the Total Environment, 2022, 851: 158318. DOI:10.1016/j.scitotenv.2022.158318 |
| [26] |
Kamble MV, Ghosh K, Rajeevan M et al. Drought monitoring over India through normalized difference vegetation index (NDVI). MAUSAM, 2010, 61(4): 537-546. DOI:10.54302/mausam.v61i4.911 |
| [27] |
Feng L, Hu CM, Chen XL et al. Assessment of inundation changes of Poyang Lake using MODIS observations between 2000 and 2010. Remote Sensing of Environment, 2012, 121: 80-92. DOI:10.1016/j.rse.2012.01.014 |
| [28] |
Shankman D, Davis L, de Leeuw J. River management, landuse change, and future flood risk in China's Poyang Lake region. International Journal of River Basin Management, 2009, 7(4): 423-431. DOI:10.1080/15715124.2009.9635400 |
| [29] |
Zeng NJ, Zhu Q, Yu CH et al. Analysis of bird fauna and biodiversity in Poyang Lake area. Wetland Science, 2019, 17(6): 611-622. [曾南京, 朱奇, 俞长好等. 鄱阳湖鸟类区系和多样性分析. 湿地科学, 2019, 17(6): 611-622.] |
| [30] |
Wang WJ, Fraser JD, Chen JK. Distribution and long-term population trends of wintering waterbirds in Poyang Lake, China. Wetlands, 2019, 39(1): 125-135. DOI:10.1007/s13157-017-0981-6 |
| [31] |
Xu J, Wang ZY, Tang S et al. Investigation and analysis of the resources of wetland plant diversity in Poyang Lake. Journal of Northwest Forestry University, 2013, 28(3): 93-97. [许军, 王召滢, 唐山等. 鄱阳湖湿地植物多样性资源调查与分析. 西北林学院学报, 2013, 28(3): 93-97. DOI:10.3969/j.issn.1001-7461.2013.03.17] |
| [32] |
Han Z, Wang SY, Liu XB et al. Ecological thresholds for the dominated wetland plants of Poyang Lake along the gradient of flooding duration. Journal of Hydraulic Engineering, 2019, 50(2): 252-262. [韩祯, 王世岩, 刘晓波等. 基于淹水时长梯度的鄱阳湖优势湿地植被生态阈值. 水利学报, 2019, 50(2): 252-262.] |
| [33] |
Zhu XL, Chen J, Gao F et al. An enhanced spatial and temporal adaptive reflectance fusion model for complex heterogeneous regions. Remote Sensing of Environment, 2010, 114(11): 2610-2623. DOI:10.1016/j.rse.2010.05.032 |
| [34] |
Zhu XL, Helmer EH, Gao F et al. A flexible spatiotemporal method for fusing satellite images with different resolutions. Remote Sensing of Environment, 2016, 172: 165-177. DOI:10.1016/j.rse.2015.11.016 |
| [35] |
Cheng Q, Liu HQ, Shen HF et al. A spatial and temporal nonlocal filter-based data fusion method. IEEE Transactions on Geoscience and Remote Sensing, 2017, 55(8): 4476-4488. DOI:10.1109/TGRS.2017.2692802 |
| [36] |
Luo JH, Yan Y, Xiao F et al. Performance of five typical spatiotemporal information fusion models in the reconstruction of vegetation index in wetland areas. Remote sensing for Natural Resources, 2024, 36(2): 60-69. [罗佳欢, 严翼, 肖飞等. 五种典型遥感时空信息融合算法在湿地区域植被指数重建中的适用性比较. 自然资源遥感, 2024, 36(2): 60-69. DOI:10.6406/zrzyyg.2023032] |
| [37] |
Du T, Xiong LH, Yi FH et al. Relation of the water area of Dongting Lake to the water levels of hydrological stations based on modis images. Resources and Environment in the Yangtze Basin, 2012, 21(6): 756-765. [杜涛, 熊立华, 易放辉等. 基于MODIS数据的洞庭湖水体面积与多站点水位相关关系研究. 长江流域资源与环境, 2012, 21(6): 756-765.] |
| [38] |
John W, David H. Measuring vegetation (NDVI & EVI): Feature articles. Environmental Science, Aug 30, 2000. https://earthobservatory.nasa.gov/features/MeasuringVegetation.
|
| [39] |
Chen LG, Chen LM, Jia JW et al. Quantitative effects of water level variation on the habitat area of wintering waterfowl in dry season of the Poyang Lake. Journal of Hydraulic Engineering, 2019, 50(12): 1502-1509. [陈炼钢, 陈黎明, 贾建伟等. 鄱阳湖枯季水位变化对越冬水鸟生境面积的定量影响. 水利学报, 2019, 50(12): 1502-1509.] |
| [40] |
Wu XX, Lv M, Jin ZY et al. Normalized difference vegetation index dynamic and spatiotemporal distribution of migratory birds in the Poyang Lake wetland, China. Ecological Indicators, 2014, 47: 219-230. DOI:10.1016/j.ecolind.2014.01.041 |
| [41] |
Xia SX, Liu Y, Chen B et al. Effect of water level fluctuations on wintering goose abundance in Poyang Lake wetlands of China. Chinese Geographical Science, 2017, 27(2): 248-258. DOI:10.1007/s11769-016-0840-z |
| [42] |
段萍. 鄱阳湖候鸟已达22万只比去年同期多10万余只. 2022-11-02. https://jndsb.jxnews.com.cn/system/2022/11/02/019832147.shtml.
|
| [43] |
Li YK, Zhong YF, Shao RQ et al. Modified hydrological regime from the Three Gorges Dam increases the risk of food shortages for wintering waterbirds in Poyang Lake. Global Ecology and Conservation, 2020, 24: e01286. DOI:10.1016/j.gecco.2020.e01286 |
| [44] |
Liu XY, Guan YN, Guo S et al. Response on wetland vegetation distribution to hydrology regularity based on harmonic time series analysis. J Lake Sci, 2016, 28(1): 195-206. [刘旭颖, 关燕宁, 郭杉等. 基于时间序列谐波分析的鄱阳湖湿地植被分布与水位变化响应. 湖泊科学, 2016, 28(1): 195-206. DOI:10.18307/2016.0123] |
| [45] |
Mu SJ, Yang GS, Xu XB et al. Assessing the inundation dynamics and its impacts on habitat suitability in Poyang Lake based on integrating Landsat and MODIS observations. Science of the Total Environment, 2022, 834: 154936. DOI:10.1016/j.scitotenv.2022.154936 |
| [46] |
Hu ZP, Tan GL, Fu J. Analysis of the reasons of the dry calamity during spring and summer in the Poyang Lake basin and the study of the drought-relief measures. Jiangxi Hydraulic Science & Technology, 2013, 39(3): 173-181. [胡振鹏, 谭国良, 傅静. 2011年春夏季鄱阳湖流域旱灾成因及对策研究. 江西水利科技, 2013, 39(3): 173-181. DOI:10.3969/j.issn.1004-4701.2013.03.04] |
| [47] |
Mei ZG, Hao YJ, Zheng JS et al. Population status and conservation outlooks of Yangtze finless porpoise in the Lake Poyang. J Lake Sci, 2021, 33(5): 1289-1298. [梅志刚, 郝玉江, 郑劲松等. 鄱阳湖长江江豚的现状和保护展望. 湖泊科学, 2021, 33(5): 1289-1298. DOI:10.18307/2021.0501] |
| [48] |
Min JL, Yu JX, Zhang YY et al. Distribution risks and protection countermeasures of Yangtze finless porpoise in Poyang Lake during abnormal dry period. Acta Hydrobiologica Sinica, 2023, 1-10. [闵佳玲, 余进祥, 张瑶瑶等. 异常枯水位期鄱阳湖长江江豚分布风险与保护对策. 水生生物学报, 2023, 1-10. DOI:10.7541/2024.2023.0182] |
| [49] |
Xia SX, Liu Y, Wang YY et al. Wintering waterbirds in a large river floodplain: Hydrological connectivity is the key for reconciling development and conservation. Science of the Total Environment, 2016, 573: 645-660. DOI:10.1016/j.scitotenv.2016.08.147 |
| [50] |
Chen J, Li YL, Shu LC et al. The influence of the 2022 extreme drought on groundwater hydrodynamics in the floodplain wetland of Poyang Lake using a modeling assessment. Journal of Hydrology, 2023, 626: 130194. DOI:10.1016/j.jhydrol.2023.130194 |
| [51] |
Shi LL, Wang YY, Jia YF et al. Vegetation cover dynamics and resilience to climatic and hydrological disturbances in seasonal floodplain: The effects of hydrological connectivity. Frontiers in Plant Science, 2017, 8: 2196. DOI:10.3389/fpls.2017.02196 |
| [52] |
Chen B, Chen LF, Huang B et al. Dynamic monitoring of the Poyang Lake wetland by integrating Landsat and MODIS observations. ISPRS Journal of Photogrammetry and Remote Sensing, 2018, 139: 75-87. DOI:10.1016/j.isprsjprs.2018.02.021 |
| [53] |
Hao GB, Wu B, Zhang LF et al. Temporal and spatial variation analysis of the area of Siling Co Lake in Tibet based on ESTARFM (1976-2014). Journal of Geo-information Science, 2016, 18(6): 833-846. [郝贵斌, 吴波, 张立福等. ESTARFM模型在西藏色林错湖面积时空变化中的应用分析(1976—2014年). 地球信息科学学报, 2016, 18(6): 833-846. DOI:10.3724/SP.J.1047.2016.00833] |
| [54] |
Guo DZ, Shi WZ, Qian FR et al. Monitoring the spatiotemporal change of Dongting Lake wetland by integrating Landsat and MODIS images, from 2001 to 2020. Ecological Informatics, 2022, 72: 101848. DOI:10.1016/j.ecoinf.2022.101848 |
 2024, Vol. 36


