(2: 中国水利水电科学研究院水生态环境研究所, 北京 100038)
(3: 信阳市淮河流域消落带碳中和工程技术研究中心, 信阳 464000)
(4: 中国长江三峡集团有限公司长江生态环境工程研究中心, 北京 100028)
(5: 上海大学环境与化学工程学院, 上海 200444)
(2: Department of Water Ecology and Environment, China Institute of Water Resources and Hydropower Research, Beijing 100038, P. R. China)
(3: Xinyang Research Center of Engineering and Technology on Carbon Neutrality of the Riparian Zone in Huaihe River Basin, Xinyang 464000, P. R. China)
(4: Yangtze River Ecological Environment Engineering Research Center, China Three Gorges Corporation, Beijing 100028, P. R. China)
(5: School of Environmental and Chemical Engineering, Shanghai University, Shanghai 200444, P. R. China)
尽管内陆水体面积相对较小,但它们在全球碳循环中发挥重要作用[1-2]。内陆水体沿着水文连续体搬运、代谢、埋藏无机碳和有机碳[3-6]。研究表明,内陆水体每年接纳5.1 Pg来自陆地生态系统的碳,向大气中释放3.9 Pg CO2,在沉积物中累积0.6 Pg有机碳,水体内部光合作用每年产生0.3 Pg碳,每年约0.95 Pg碳被运输到海洋[7-8]。水库作为内陆水体的重要组成部分,不仅向大气中排放CO2、CH4等温室气体[9-10],而且对内陆水体有机碳埋藏通量的贡献比例为40% ~50% [11-12]。科研工作者针对人工水库温室气体释放已经开展了大量研究[13-16]。然而,从全球尺度来看,现有水库碳埋藏研究案例有限且分布不均衡[2, 12, 17]。水库埋藏的部分有机碳能够抵消其排放的部分温室气体,因此有必要将水库碳埋藏纳入全球碳收支[18]。
水库有机碳埋藏通量取决于一系列生物和非生物因素,包括生产力、地质、土地利用和流域形态[12, 19]。水库有机碳埋藏量通常由水体表面积和有机碳埋藏速率计算获得,其估算结果具有不确定性,这是因为水库水下地形复杂程度高于湖泊,其有机碳埋藏速率具有高度的空间异质性,如东风水库有机碳埋藏速率低至0,高达23170 g/(m2 ·a) [20]。研究表明,水库有机碳埋藏速率受水体表面积、补给系数、降雨量、耕地面积比例、温度和坡度影响[12, 21-22]。沉积物有机碳埋藏速率估算方法分为重复测深法[21]、放射性同位素计年法[23-24]、沉积物捕获器法[25]、质量平衡模型法[19, 26]、沉积物柱法[27-28]和声学调查法[17, 20, 29-30]。利用重复测深法、放射性同位素计年法、沉积物捕获器法、沉积物柱法和质量平衡模型法获取水库沉积物有机碳埋藏速率通常面临困难和挑战。重复测深法需要历史测深数据做比较,但难以获得准确的历史测深数据,因此通常情况下估算结果不准确。水库沉积物放射同位素计年涉及一系列复杂问题,如沉积的空间异质性、沉积物的混合和迁移,通常会遇到困难甚至是不可行的[29]。沉积柱法和沉积物捕获器法样本采集量大,不适合深水水库有机碳埋藏速率估算。质量平衡模型法需要长时间序列和高频的监测数据支持[19, 30], 因而使用场景受限。然而,基于声学的浅地层剖面系统能够全面地勾勒水库沉积物淤积分布,结合典型区域沉积柱理化参数,能够较准确地估算有机碳埋藏速率和有机碳埋藏通量[17, 20, 29-30]。
全球的主要河流都受到不同程度的筑坝拦截影响[31],河道型水库是流域综合水能开发的一种重要类型[32]。河流拦截蓄水后,水体在河流中滞留时间延长,导致库区水体流速减缓、河流携沙能力下降,河流侵蚀搬运作用减弱,湖泊沉积作用增强[33]。受营养盐刺激,水生光合作用将水体中无机生源物质按照Redfield比转化为有机质[34],导致无机生源物质参加生物循环而滞留在水库中。颗粒有机碳沉积到沉积物表面以后,一部分有机碳被异养微生物矿化分解为CO2和CH4,剩余部分有机碳被埋藏在沉积物中[35]。水库沉积物中有机碳可分为初级生产力生成的内源有机碳和陆地固定的有机碳[17, 22]。有研究认为,如果没有建造大坝,陆源有机碳将被埋藏在冲积平原或者海洋,从某种程度上讲,水库埋藏的陆源有机碳只涉及存储位置改变[12, 36]。然而,由初级生产者固定CO2生成的内源有机碳被认为是一个新的碳汇,必须纳入陆地碳收支[2, 12]。
河道型水库是指在山谷或者河流的狭口处筑坝拦截的人工湖泊[37],兼具河流和湖泊生态系统的双重特性。河道型水库具有以下形态结构特征:(1)水深和水面宽都远小于库长[38];(2)库首水域面积大,水深较深,水流速度低;(3)库尾水域面积小,水深较浅,水流速度较大[39-40]。水库是介于天然湖泊和河流之间的人工水体,水体滞留时间越长越趋向湖泊生态系统特性,水体滞留时间越短越趋向河流生态系统特性。河道型水库水体滞留时间较短,以往研究主要关注其温室气体释放,而碳埋藏容易被忽视。河道型水库数量众多,研究人员对河道型水库碳埋藏缺乏认识,这进一步加大了全球水库碳埋藏通量估算的不确定性。此外,水下复杂的地形和沉积的空间异质性影响了河道型水库碳埋藏估算[17, 20, 41],因此准确地评估河道型水库碳埋藏通量显得尤为重要。西南地区水能资源富集,可用于经济开发的装机容量占全国的61% [42],是我国现在和未来筑坝的重点区域。思林水库位于乌江干流梯级水电开发的第8级,平均水深42 m,水面一般宽度300~800 m,库长89 km;库首水深82 m,库首水流速度0.3 m/s;库尾水深27 m,库尾水流速度0.4 m/s,平面形态狭长,是典型的河道型水库。因此,本研究以乌江流域河道型水库(思林水库)为研究对象,采用声学调查法获得水库沉积物淤积分布情况,结合柱状沉积物理化参数,计算水库沉积物淤积量和碳埋藏通量,借助沉积物碳同位素技术,区分沉积物有机碳来源比例,量化内源有机碳埋藏通量,明确河流筑坝拦截效应,为准确评估河道型水库埋藏通量提供参考性案例。
1 材料与方法 1.1 研究区域概况乌江源头位于云贵高原乌蒙山东麓,是长江上游右岸最大的一条支流,也是流经贵州省内的第一大河流[43]。乌江干流全长1037 km,流域面积87920 km2,地跨云南省、贵州省、重庆市和湖北省。河源至六冲河和三岔口交汇处为上游,交汇处至思南为中游,思南至涪陵为下游。乌江流域属于亚热带季风气候,多年平均气温为14.6 ℃。乌江流域多年平均降雨量约为1100~1300 mm,降雨主要集中在5—10月,其降雨量约占全年总降雨量的75% [44]。流域内沉积岩发育良好,地层比较齐全,碳酸盐岩分布广泛,其中贵州省内碳酸盐岩出露面积占全省总面积的73.6% [45]。乌江上游以二叠系和三叠系碳酸盐岩、含煤岩组和玄武岩为主[46],中游主要有二叠系和三叠系石灰岩、白云质灰岩和白云岩分布[44],下游碳酸盐岩、页岩、砂页岩和粉砂岩分布广泛[47]。
思林水电站位于乌江干流中游思南县境内,于2004年开工建设,2009年蓄水发电。思林水库控制流域面积为48558 km2,正常蓄水位440 m,水库面积38.35 km2,总库容15.93亿m3,坝址多年平均流量为858 m3/s,属于日调节水库[48],水体滞留时间为21.5 d。
1.2 声学数据采集和处理2018年12月,采用配备3.5 kHz和10 kHz声源/接收器的浅地层剖面仪(StrataBox HD 3510, SyQuest, USA)观测思林水库沉积物淤积分布。水库建设前,原河床由裸露的基岩和土壤层组成;蓄水后,河流输送的颗粒物在水库中沉积,形成松散的高含水量沉积物累积在水库中。这在声学特性上与水库建设前的河床底部明显不同。因此,自水库建成以来,沉积物的厚度可以通过声反射信号来确定。选择能见度高、风力小的天气进行野外作业,船速保持匀速(7 km/h左右),按照等间隔测量横断面,并进行纵横交错式走航。使用差分全球定位系统(DGPS)获得位置数据,并在走航期间将声学信号记录在便携式计算机中。采用Hypack软件(Xylem, Inc., USA)对获得的浅剖数据进行数字化处理,获得各点位的水体深度数据和松散沉积物底部(基岩表面)深度数据,沉积物厚度由这两者之间的差值计算得到。然后,采用反距离加权算法(Surfer 12, Golden Software, Inc., USA)对获得的沉积物厚度进行插值[20, 29-30],其不确定性主要来源于水库水下地形起伏的程度[49]。水库边界的沉积物厚度被设置为0,因为没有沉积物累积在水库边缘[29-30]。
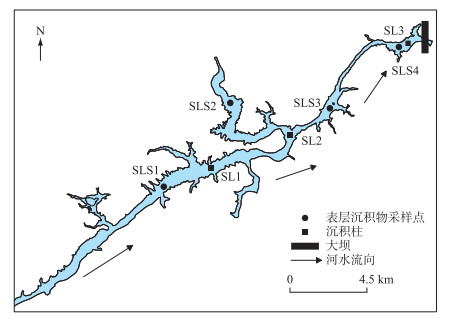
1.3 表层和柱状沉积物采集鉴于枯水期沉积物受底层水流和环境因素扰动少,2017年10月,采用抓斗在库中和库首采集表层沉积物。2018年12月,采用便携式重力采样器在思林水库库尾、库中开阔水域采集沉积柱,使用抓斗在入库和支流采集表层沉积物。采样点SL1、SL2、SLS1、SLS2、SLS3和SLS4位置分布见图 1。采得未受扰动的沉积物柱芯SL1和SL2长度分别为37和18 cm。现场分割沉积物柱芯,0~20 cm按照1 cm间隔切割,20 cm以下按照2 cm间隔切割。将分割后的沉积物依次放入已编号且干燥清洁的自封袋,现场称湿重,样品运回实验室并保存在-20 ℃冰箱中。
|
图 1 思林水库沉积物采样点分布 Fig.1 The location of sediment sampling sites in the Silin Reservoir |
沉积物含水率(WC)采用重量法测定,根据湿沉积物冷冻干燥前后质量差计算获得。沉积物总有机碳(TOC)、总氮(TN)和δ13C采用元素分析仪(Flash 2000HT)和同位素质谱仪(MAT253)联合测定,其中TOC和TN含量采用优级纯乙酰苯胺建立质量与CO2和N2峰面积线性回归曲线获得,δ13C组成采用国际标准物质IAEA601和标准乙酰苯胺校准δ13C同位素值,δ13C同位素值的标准偏差小于0.2‰。预处理步骤为:(1)沉积物干燥后研磨过100目筛,称取适量样品置于离心管中,加入足量2 mol/L的HCl去除无机碳,振荡过夜,直至无气泡冒出;(2)采取离心加速沉淀和去离子水洗除残留酸,处理样品至pH呈中性;(3)冷冻干燥处理过的沉积物样品,研磨后置于玻璃瓶待测。
沉积物总磷(TP)含量采用硫酸和高氯酸高温消解结合磷钼蓝分光光度法测定[50]。操作步骤为:(1)称取经冷冻干燥、研磨过100目筛的沉积物0.3 g,置于消解罐中,先加入4.5 mL浓硫酸,再加入0.5 mL高氯酸,190 ℃加热12 h,冷却;(2)用去离子水将消化管中消解液全部转移到100 mL容量瓶中,冷却,加水定容,摇匀;(3)静置过夜,次日吸取上清液进行TP含量的测定。
1.5 计算采用经纬度计算水库地图东西间和南北间距离[51],得到矩形区域的面积。矩形区域面积被均分为大量矩形网格,单个网格面积为S(m2)。根据网格面积和沉积物厚度d(m),计算每个网格对应的沉积物体积Vi(m3),结合含水率(WC, %)、干密度(ρ, g/cm3)和TOC估算沉积物质量(Ms, g)、有机碳质量(OCMs, g)和有机碳埋藏速率(organic carbon burial rate, OCBR, g/(m2 ·a))。有效的碳埋藏面积根据单个网格面积和网格数量计算,网格数量由采用Sufer 12通过沉积物厚度插值获得。计算公式如下:
| Ms=n∑i=1Vi⋅ρ⋅(1−φ)×106 | (1) |
| OCMs=n∑i=1Vi⋅ρ⋅(1−φ)⋅TOC×106 | (2) |
| OCBR=d⋅ρ⋅(1−φ)⋅TOC×106/R | (3) |
式中,R表示水库的年龄(取9年, 2009—2018年);ρ为沉积物干密度,φ为孔隙度,计算公式如(4)~(5)[52]所示。
| ρ=2.65−0.0523⋅TOC(%) | (4) |
| φ=WC⋅ρwater /(WC⋅ρwater +(1−WC)ρ) | (5) |
式中,ρwater表示水的密度,单位是1 g/m3。受采样器长度的限制,在一些沉积物堆积较厚的地区,很难获得完整的沉积柱芯。然而研究表明,水库沉积物TOC含量在深度0.2 m以下变化不大[53]。因此,本文假设沉积物TOC含量在沉积柱长度以下保持不变。用于计算的沉积物理化参数平均值如表 1所示。
| 表 1 思林水库不同深度沉积物含水率、孔隙度和有机碳均值 Tab. 1 The average of water content, porosity and TOC of sediment in different depths in the Silin Reservoir |
采用二元混合模型计算水库内源有机碳和外源有机碳对总有机碳的贡献比例[24, 50]。陆生C3和C4植物在土壤中被分解前对沉积物有机碳没有直接贡献,因此用陆地土壤有机质来表示陆源有机碳的来源。野外观测发现,思林水库中没有大型植物生长,浮游植物被认为是内源有机碳的来源。有研究表明,乌江流域浮游植物δ13C变化范围为-32.55‰ ~-24.41‰,平均值为-29.6‰ [56]。研究区域附近土壤有机质δ13C变化范围为-23.4‰ ~-21.6‰,平均值为-22.2‰ [57]。水库内源有机碳和陆源有机碳对总有机碳的贡献比例按照公式(6)~(7)计算:
| δ13Cs=fauto δ13Cauto +fallo δ13Callo | (6) |
| 1=fauto +fallo | (7) |
式中, δ13Cs、δ13Cauto和δ13Callo分别表示沉积物总有机碳、内源有机碳和陆源有机碳的碳同位素值,fauto和fallo分别表示水库内源有机碳和陆源有机碳占总有机碳的比例。
1.6 统计分析采用OriginPro 2021软件对沉积物理化参数进行描述性统计分析;对水库沉积物内源有机碳与TN、TP含量进行相关分析,判别它们之间是否存在相关关系。
2 结果与分析 2.1 沉积物淤积分布思林水库沉积物淤积分布明显表现出高度的空间异质性。在水库的边缘没有观测到沉积物累积,深水区域淤积了较厚的沉积物(图 2)。思林水库沉积物淤积分布模式可能是因为:(1)浅水区沉积物在水位变动期间容易再悬浮;(2)在下坡重力和水流运移的共同作用下沉积物被输送到深水区[29, 58-59]。在浅水区沉积物柱芯较短,在深水区沉积物柱芯较长。在沉积物堆积较薄的地区,沉积物柱芯的长度与浅地层剖面仪获得的沉积物厚度相对应。受采样器长度的限制,在沉积物堆积较厚的地区,沉积物柱芯的长度无法与浅地层剖面仪获得的沉积物厚度相比较。然而,Mendonça等[29]和Wang等[30]已经证实浅地层剖面仪在沉积物堆积较厚地区的可靠性。思林水库沉积物厚度变化范围为0~3.53 m,大多数沉积物沿着原始河道沉积(图 2)。

|
图 2 思林水库水深等深图(a)和沉积物等厚图(b) Fig.2 Counter maps of water depth (a) and sediment thickness (b) of the Silin Reservoir |
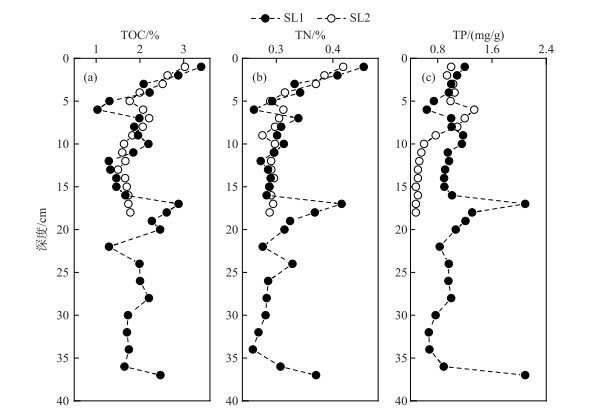
表层沉积物TOC、TN和TP含量的变化范围分别为1.24% ~2.05%、0.17% ~0.33% 和0.49~0.86 mg/g,平均值分别为1.52%、0.24% 和0.75 mg/g。沉积柱SL1的TOC、TN和TP含量的变化区间分别为1.03% ~3.40%、0.26% ~0.45% 和0.64~2.09 mg/g,平均值分别为1.97%、0.32% 和1.04 mg/g(图 3)。沉积柱SL2的TOC、TN和TP含量的变化范围分别为1.50% ~3.03%、0.28% ~0.42% 和0.48 ~1.34 mg/g,平均值分别为1.95%、0.31% 和0.78 mg/g(图 3)。表层沉积物SLS3的TOC和TN含量(1.35% 和0.19%)与Lin等[60]对思林水库库中表层沉积物TOC和TN含量的研究结果相近(1.26% 和0.16%),表层沉积物SLS4的TOC和TN含量(1.24% 和0.17%)与Lin等[60]、刘坤等[55]对思林水库库首表层沉积物TOC和TN含量的研究结果一致(1.15% 和0.15%、1.28% 和0.18%)。表层沉积物SLS4的TP含量(0.82 mg/g)与刘坤等[55]对思林水库库首表层沉积物TP含量均值的研究结果接近(0.94 mg/g)。沉积柱SL1的TOC、TN均值与沉积柱SL2的TOC、TN均值接近。沉积柱SL1的TP均值大于沉积柱SL2的TP均值。
|
图 3 思林水库沉积柱TOC (a)、TN (b)和TP(c) Fig.3 TOC (a), TN (b) and TP (c) of sediment cores in the Silin Reservoir |
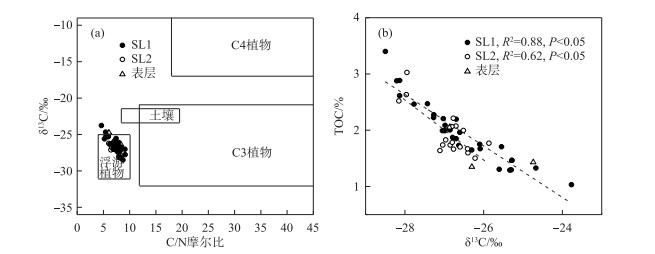
表层沉积物δ13C值和C/N摩尔比的变化范围分别为-26.9‰ ~-24.7‰和6.04~8.46,平均值分别为-26.2‰和7.51。沉积柱SL1和SL2的δ13C值波动范围分别为-28.5‰ ~-23.8‰和-28.2‰ ~-25.9‰ (图 4a),均值分别为-26.6‰和-26.9‰。沉积柱SL1和SL2的C/N摩尔比的变化范围分别为4.62~9.14和6.02~8.47(图 4b),均值分别为7.19和7.27。表层沉积物SLS3的δ13C值和C/N摩尔比(-26.3‰和8.30)与Lin等[60]对思林水库库中表层沉积物的δ13C值和C/N摩尔比的研究结果相近(-24.8‰和9.14)。表层沉积物SLS4的C/N摩尔比(8.46)与Lin等[60]、刘坤等[55]对思林水库库首表层沉积物C/N摩尔比的研究结果相一致(8.81、8.26)。沉积柱SL1的δ13C、C/N摩尔比均值与沉积柱SL2的δ13C、C/N摩尔比均值接近。

|
图 4 思林水库沉积柱δ13C (a)和C/N摩尔比(b) Fig.4 δ13C (a) and C/N molar ratio(b) of sediment cores in the Silin Reservoir |
表层沉积物陆源有机碳对总有机碳贡献比例的波动范围为36.5% ~65.6%,均值为45.9%;沉积柱SL1和SL2陆源有机碳对总有机碳贡献比例的变化范围分别为14.9% ~78.8% 和19.5% ~50.5%,均值分别为41.1% 和36.7%。表层沉积物内源有机碳对总有机碳贡献比例的波动范围为34.4% ~63.5%,均值为54.1%;沉积柱SL1和SL2内源有机碳对总有机碳贡献比例的变化范围分别为21.2% ~85.1% 和49.5% ~80.5%,均值分别为58.9% 和63.3%。所有沉积物陆源有机碳和内源有机碳对总有机碳贡献比例的变化范围分别是14.9% ~78.8% 和21.2% ~85.1%,均值分别为39.9% 和60.1%。思林水库内源有机碳对总有机碳的贡献比例均值与Wei等[11]对红枫湖水库沉积物内源有机碳来源比例均值的研究结果接近(59.5%),表层沉积物SLS4内源有机碳对总有机碳贡献比例(63.5%)大于Lin等[60]对思林水库库首表层沉积物内源有机碳来源比例的研究结果(42.0%)。
沉积柱SL1和SL2内源有机碳对总有机碳贡献比例的最小值分别出现在深度6和5 cm处(图 4)。虽然本文缺少放射性同位素计年数据支持,但可以推断,柱芯SL1和SL2各自在深度6和5 cm处对应的时间为2016年。这是因为:(1)公开信息显示,2016年7月,思林水库发生了200年一遇的特大暴雨(http://gzw.guizhou.gov.cn),导致陆源有机质输入增加;(2)沉积柱SL1和SL2中有机碳主要来源于内源有机质,其δ13C信号容易受到陆源有机质输入变化的影响。
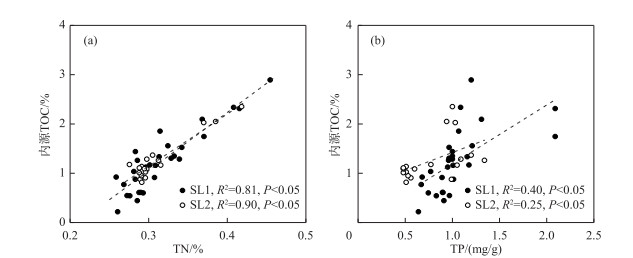
2.4 相关分析思林水库沉积柱SL1和SL2内源有机碳含量与总氮、总磷含量呈显著正相关(图 5),显示内源有机碳含量随氮、磷营养盐的输入而升高。
|
图 5 思林水库沉积物内源有机碳与总氮(a)和总磷(b)含量的关系 Fig.5 Relationship between content of autochthonous TOC and TN (a), TP (b) of sediment cores in Silin Reservoir |
2009—2018年期间,思林水库累积的沉积物总体积估算值为6.12×10⁶ m3,沉积物总质量变化范围为0.92×10¹³~1.25×10¹³ g,估算值为1.06×10¹³ g。思林水库有机碳埋藏总质量变化范围为0.75×10¹¹~4.25×10¹¹ g,估算值为1.94×10¹¹ g,这与采用沉积物总质量和TOC含量的计算结果相近(平均值为1.83×10¹¹ g,范围为0.86×10¹¹~3.59×10¹¹ g)。思林水库有机碳埋藏通量变化范围为0.84×10¹⁰ ~4.72×10¹⁰ g/a,估算值为2.16×1010 g/a。思林水库有机碳埋藏速率变化范围为0~12133.4 g/(m2 ·a),平均值为1429.8 g/(m2 ·a)。思林水库累积的沉积物总质量、有机碳总质量、有机碳埋藏通量和有机碳埋藏速率估算的不确定性是由沉积物物理化学参数的空间异质性造成的。
3 讨论 3.1 沉积物累积总量研究表明,构皮滩水库2004年开工建设,1980—2004年期间思南水文站年平均输沙量为4.23×10¹² g[61],思林水库2005年开始修建,2005—2014年期间思南水文站年平均输沙量为1.27×10¹² g[61]。思南水文站位于构皮滩水库和思林水库的下游,思林水库建成后,部分泥沙被拦截在水库内,导致思南水文站年均输沙量减少,思林水库泥沙年均淤积量为2.96×10¹² g。因此,2009—2014年淤积在思林水库的泥沙质量为1.48×10¹³ g。
思林水库沉积物总质量估算值低于Wu等[61]基于思南水文站年均输沙量变化的计算值,这是因为:(1)部分沉积物沉积在思林水库至思南水文站之间的河床上;(2)本文未考虑水库部分支流沉积物的聚集;(3)水土保持措施导致泥沙输入减少[61-62]。
3.2 有机碳的主要来源水库沉积物中有机碳主要有两类来源:(1)水库内部的水生生物(内源);(2)水库周围的陆生生物(外源或陆源)。C/N摩尔比与δ13C值相结合能够很好地识别沉积物中有机碳的来源[63-64]。陆生高等植物富含纤维素,蛋白质含量偏少,其C/N摩尔比大于20[65-66];水生植物富含蛋白质,纤维素含量较少,其C/N摩尔比为4~10[67-68]。研究表明,沉积物中陆源有机碳占比越大,C/N摩尔比越高[69]。不同植物光合作用方式不同造成碳同位素分馏作用的差异,不同植物具有不同的碳同位素组成。C3植物的δ13C值在-32‰ ~-21‰之间,C4植物的δ13C值变化范围为-17‰ ~-9‰,CAM类植物δ13C值处于-28‰ ~-11‰之间,水生浮游植物δ13C值范围为-31‰ ~-25‰ [70]。通常情况下,土壤C/N摩尔比为8~15,δ13C值变化范围为-25‰ ~-22‰ [71-72]。有研究表明,乌江流域土壤C/N摩尔比为8.4~19.5,均值为12.3[73]。沉积物中有机碳C/N摩尔比(4.62~9.14)和δ13C值(-28.5‰ ~-23.8‰)表明,沉积物有机碳主要来源于水生浮游植物(图 6a),内源有机碳对总有机碳的贡献比例较大(图 6b)。此外,思林水库氮、磷营养盐的输入促进了内源有机质的增加(图 5)。
|
图 6 C/N摩尔比结合δ13C判别有机碳的来源(a)和有机碳含量与δ13C的关系(b) Fig.6 Different sources of organic carbon using C/N molar ratios and δ13C values (a) and relationship between TOC and δ13C of sediments (b) |
二元碳同位素混合模型结果显示,思林水库沉积物中39.9% 的总有机碳来源于陆源有机质,60.1% 的总有机碳来源于内源有机质。因此,思林水库内源有机碳和陆源有机碳埋藏速率分别为859.3和570.4 g/(m2 ·a);内源有机碳和陆源有机碳埋藏通量分别为1.30×10¹⁰和0.86×10¹⁰ g/a。
3.3 不同类型水库的有机碳埋藏通量和有机碳埋藏速率有机碳埋藏通量受水体面积、土地利用、周边土壤和植被特征影响强烈,沉积速率能够很好地表征水体面积、土地利用和流域坡度,水库沉积速率越高,其有机碳埋藏通量越大[22]。思林水库沉积速率为4.51 cm/a,有机碳埋藏通量为2.16×1010 g/a,小于非洲贫营养水库有机碳埋藏通量(1.2×1011 g/a,沉积速率为10 cm/a)[24],大于巴西东南部贫营养水库有机碳埋藏通量(1.2×1010 g/a,沉积速率为0.51 cm/a)[29]。思林水库有机碳埋藏通量与乌江流域东风水库有机碳埋藏通量接近(2.37×1010 g/a,沉积速率为5.69 cm/a)[20],大于乌江渡水库和红枫湖水库有机碳埋藏通量(1.37×1010、3.52×109 g/a,沉积速率分别为1.34、0.55 cm/a)[17, 30]。思林水库有机碳埋藏通量相当于全球水库有机碳埋藏通量的0.36‰ [12],表明河道型水库对全球水库碳埋藏通量的贡献不容小觑。研究表明,思林水库水-气界面CO2释放通量为4.05×10¹⁰g/a[74],其有机碳埋藏通量相当于水-气界面CO2释放通量的0.53倍,其内源有机碳埋藏通量相当于水-气界面CO2释放通量的0.32倍。在全球河流普遍筑坝拦截的背景下,河道型水库内源碳汇潜力不容忽视。
有研究表明,水库有机碳埋藏速率与水体表面积呈反比关系[21-22]。思林水库有机碳埋藏速率平均值为1429.8 g/(m2 ·a),小于美国爱荷华州农业密集区小型富营养水库有机碳埋藏速率平均值(3200 g/(m2 ·a),面积为0.01~19.83 km2)[21],大于非洲赞比亚大型贫营养水库和巴西大型贫营养水库有机碳埋藏速率均值(分别为23.0、42.2 g/(m2 ·a),面积分别为5364、272 km2)[24, 29]。思林水库有机碳埋藏速率平均值小于乌江流域东风水库有机碳埋藏速率均值(1940 g/(m2 ·a),面积为19.25 km2)[20],大于乌江渡水库和红枫湖水库有机碳埋藏速率均值(分别为579.2、117.5 g/(m2 ·a),面积分别为47.8、57.2 km2)[17, 30],也大于滇池流域双龙水库有机碳埋藏速率均值(69.8 g/(m2 ·a),面积为66.7 km2)[23]。思林水库有机碳埋藏速率均值与瑞士小型中营养河道型水库有机碳埋藏速率均值接近(1113 g/(m2 ·a))[35]。
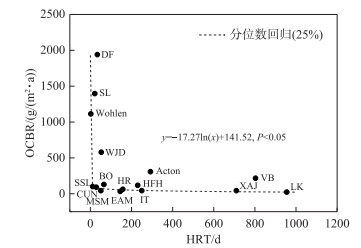
受流域综合水能开发定位的影响,水库具有不同的调节类型(日调节到多年调节),主要表现为水体滞留时间长短的差异[32]。研究表明,水体滞留时间不仅直接影响到水库浮游植物生产力以及群落大小和组成[75-76],而且是水库有机质滞留的一个重要决定性因素[77]。本研究(思林水库, SL)综合了有关报道(Yu等[20](东风水库,DF)、Sobek等[35](Wohlen Reservoir,Wohlen)、Qin等[17](乌江渡水库,WJD)、Wang等[30](红枫湖水库,HFH)、Knoll等[19](Acton Reservoir,Acton;Burr Oak Reservoir,BO)、Kunz等[24](Lake Kariba Reservoir,LK)、Kunz等[26](Itezhi-Tezhi Reservoir,IT)、Teodoru等[25](Eastmain-1 Reservoir,EAM)、贾晓斌[81](新安江水库,XAJ)、Luo等[27](怀柔水库,HR;十三陵水库,SSL)、Carnero-Bravo等[82](Valle de Bravo Reservoir,VB、Mendonça等[29](Mascarenhas de Moraes Reservoir,MSM)、Quadra等[2](Curuá Una Reservoir,CUN))发现,水库有机碳埋藏速率随水体滞留时间(HRT)的增加呈对数级下降(图 7)。这是因为:(1)随着水体滞留时间的缩短,水库水体稳定性减弱[78],初级生产力减小[27],内源有机质输入减小,外源有机质输入增加,导致沉积速率增大,减少了沉积物孔隙水溶解氧暴露时间,阻碍有机质的矿化分解,促使有机碳埋藏速率升高[77, 79];(2)随着水体滞留时间的延长,水库水体稳定性增强[78],初级生产力增加[27],内源有机质输入升高,外源有机质输入降低,导致沉积速率减小,同时内源有机质易于矿化分解[79],使得有机碳埋藏速率降低。该经验函数关系与Mulholland等[80]和Phyoe等[77]对河流、水库和天然湖泊的有机碳埋藏速率与水体滞留时间关系的研究结果相近。
|
图 7 水库有机碳埋藏速率与水体滞留时间(HRT)的关系(简写对应的水库名称见正文) Fig.7 Relationship between organic carbon burial rate of reservoirs and hydraulic retention time(HRT) |
本研究采用声学调查法和柱状沉积物理化参数估算了乌江流域河道型水库(思林水库)沉积物淤积总质量、有机碳埋藏通量和有机碳埋藏速率,结合碳同位素二元混合模型量化陆源有机碳和内源有机碳对沉积物总有机碳的贡献比例,并估算陆源有机碳埋藏通量和内源有机碳埋藏通量,准确地评估河道型水库固碳潜力,探讨了水库有机碳埋藏速率与水体滞留时间的关系,得出以下主要结论:
1) 思林水库沉积物淤积分布表现出高度的空间异质性,浅水区沉积物厚度较薄,深水区沉积物堆积较厚,大多数沉积物沿着原始河道沉积。
2) 思林水库沉积物C/N摩尔比和δ13C值的变化范围分别为4.62~9.14和-28.5‰ ~-23.8‰,平均值分别为7.24和-26.6‰,显示沉积物有机质主要来源于水生浮游植物;碳同位素二元混合模型结果表明,陆源有机质和内源有机质对沉积物总有机碳的贡献比例范围分别为14.9% ~78.8% 和21.2% ~85.1%,平均值分别为39.9% 和60.1%;营养盐氮、磷的输入促进了水库内源有机质的生成。
3) 2009—2018年间,思林水库累积的沉积物总质量和有机碳总质量分别为1.06×10¹³和1.94×10¹¹ g;思林水库有机碳埋藏速率范围为0~12133.4 g/(m2 ·a),平均值为1429.8 g/(m2 ·a),有机碳埋藏通量为2.16×10¹⁰ g/a,相当于全球水库有机碳埋藏通量的0.36‰,内源有机碳通量为1.30×1010 g/a,相当于水-气界面CO2释放通量的0.32倍,表明河道型水库内源碳汇潜力不容忽视。
4) 水库有机碳埋藏速率与水体滞留时间呈对数函数关系,该函数关系将有助于估算全球水库有机碳埋藏速率。
| [1] |
Battin TJ, Lauerwald R, Bernhardt ES et al. River ecosystem metabolism and carbon biogeochemistry in a changing world. Nature, 2023, 613(7944): 449-459. DOI:10.1038/s41586-022-05500-8 |
| [2] |
Quadra GR, Sobek S, Paranaíba JR et al. High organic carbon burial but high potential for methane ebullition in the sediments of an Amazonian hydroelectric reservoir. Biogeosciences, 2020, 17(6): 1495-1505. DOI:10.5194/bg-17-1495-2020 |
| [3] |
Park JH, Nayna OK, Begum MS et al. Reviews and syntheses: Anthropogenic perturbations to carbon fluxes in Asian river systems: Concepts, emerging trends, and research challenges. Biogeosciences Discussions, 2018, 15(9): 1-43. DOI:10.5194/bg-15-3049-2018 |
| [4] |
Drake TW, Podgorski DC, Dinga B et al. Land-use controls on carbon biogeochemistry in lowland streams of the Congo Basin. Global Change Biology, 2020, 26(3): 1374-1389. DOI:10.1111/gcb.14889 |
| [5] |
Maavara T, Chen QW, Van Meter K et al. River dam impacts on biogeochemical cycling. Nature Reviews Earth & Environment, 2020, 1(2): 103-116. DOI:10.1038/s43017-019-0019-0 |
| [6] |
Woelmer WM, Hounshell AG, Lofton ME et al. The importance of time and space in biogeochemical heterogeneity and processing along the reservoir ecosystem continuum. Aquatic Sciences, 2023, 85(2): 66. DOI:10.1007/s00027-023-00959-7 |
| [7] |
Drake TW, Raymond PA, Spencer RG. Terrestrial carbon inputs to inland waters: A current synthesis of estimates and uncertainty. Limnology and Oceanography Letters, 2018, 3(3): 132-142. DOI:10.1002/lol2.10055 |
| [8] |
Han QH, Wang L, Huang LP et al. Anthropogenic control of coupled changes in organic and inorganic carbon burial in Karst landscape: Sediment evidence from two lakes of subtropical China. Ecological Indicators, 2022, 138: 108811. DOI:10.1016/j.ecolind.2022.108811 |
| [9] |
Tranvik LJ, Downing JA, Cotner JB et al. Lakes and reservoirs as regulators of carbon cycling and climate. Limnology and Oceanography, 2009, 54(6): 2298-2314. DOI:10.4319/lo.2009.54.6_part_2.2298 |
| [10] |
Gruca-Rokosz R, Ciesla M. Sediment methane production within eutrophic reservoirs: The importance of sedimenting organic matter. Science of the Total Environment, 2021, 799: 149219. DOI:10.1016/j.scitotenv.2021.149219 |
| [11] |
Wei Y, Yan H, Liu ZH et al. The ballast effect controls the settling of autochthonous organic carbon in three subtropical Karst Reservoirs. Science of the Total Environment, 2022, 818: 151736. DOI:10.1016/j.scitotenv.2021.151736 |
| [12] |
Mendonça R, Müller RA, Clow D et al. Organic carbon burial in global lakes and reservoirs. Nature Communications, 2017, 8(1): 1694. DOI:10.1038/s41467-017-01789-6 |
| [13] |
Barros N, Cole JJ, Tranvik LJ et al. Carbon emission from hydroelectric reservoirs linked to reservoir age and latitude. Nature Geoscience, 2011, 4(9): 593-596. DOI:10.1038/ngeo1211 |
| [14] |
Deemer BR, Harrison JA, Li SY et al. Greenhouse gas emissions from reservoir water surfaces: A new global synthesis. BioScience, 2016, 66(11): 949-964. DOI:10.1093/biosci/biw117 |
| [15] |
Li SY, Bush RT, Santos IR et al. Large greenhouse gases emissions from China's Lakes and reservoirs. Water Research, 2018, 147: 13-24. DOI:10.1016/j.watres.2018.09.053 |
| [16] |
Soued C, Harrison JA, Mercier-Blais S et al. Reservoir CO2 and CH4 emissions and their climate impact over the period 1900-2060. Nature Geoscience, 2022, 15(9): 700-705. DOI:10.1038/s41561-022-01004-2 |
| [17] |
Qin Y, Hao F, Zhang D et al. Accumulation of organic carbon in a large canyon reservoir in Karstic Area, Southwest China. Environmental Science and Pollution Research, 2020, 27(20): 25163-25172. DOI:10.1007/s11356-020-08724-1 |
| [18] |
Fang NF, Zeng Y, Ran LS et al. Substantial role of check dams in sediment trapping and carbon sequestration on the Chinese Loess Plateau. Communications Earth & Environment, 2023, 4(1): 65. DOI:10.1038/s43247-023-00728-2 |
| [19] |
Knoll LB, Vanni MJ, Renwick WH et al. Temperate reservoirs are large carbon sinks and small CO2 sources: Results from high-resolution carbon budgets. Global Biogeochemical Cycles, 2013, 27(1): 52-64. DOI:10.1002/gbc.20020 |
| [20] |
Yu NX, Qin Y, Hao F et al. Using seismic surveys to investigate sediment distribution and to estimate burial fluxes of OC, N, and P in a canyon reservoir. Acta Geochimica, 2019, 38(6): 785-795. DOI:10.1007/s11631-019-00353-x |
| [21] |
Downing JA, Cole JJ, Middelburg JJ et al. Sediment organic carbon burial in agriculturally eutrophic impoundments over the last century. Global Biogeochemical Cycles, 2008, 22(1): GB1018. DOI:10.1029/2006GB002854 |
| [22] |
Clow DW, Stackpoole SM, Verdin KL et al. Organic carbon burial in lakes and reservoirs of the conterminous United States. Environmental Science & Technology, 2015, 49(13): 7614-7622. DOI:10.1021/acs.est.5b00373 |
| [23] |
Wang XL, Liu JL, Kitch J et al. Evaluating the effectiveness of sediment retention by comparing the spatiotemporal burial of sediment carbon, nitrogen and phosphorus in a plateau lake and its affiliated reservoirs. CATENA, 2023, 223: 106896. DOI:10.1016/j.catena.2022.106896 |
| [24] |
Kunz MJ, Anselmetti FS, Wüest A et al. Sediment accumulation and carbon, nitrogen, and phosphorus deposition in the large tropical Reservoir Lake Kariba(Zambia/Zimbabwe). Journal of Geophysical Research, 2011, 116(G3): G03003. DOI:10.1029/2010jg001538 |
| [25] |
Teodoru CR, Bastien J, Bonneville MC et al. The net carbon footprint of a newly created boreal hydroelectric reservoir. Global Biogeochemical Cycles, 2012, 26(2): GB2016. DOI:10.1029/2011gb004187 |
| [26] |
Kunz MJ, Wuest A, Wehrli B et al. Impact of a large tropical reservoir on riverine transport of sediment, carbon, and nutrients to downstream wetlands. Water Resources Research, 2011, 47(12): W12531. DOI:10.1029/2011wr010996 |
| [27] |
Luo Z, Ma JM, Zheng SL et al. Different hydrodynamic conditions on the deposition of organic carbon in sediment of two reservoirs. Hydrobiologia, 2016, 765(1): 15-26. DOI:10.1007/s10750-015-2410-2 |
| [28] |
Pittman B. Sediment organic carbon distribution in 4 small northern Missouri impoundments: Implications for sampling and carbon sequestration. Inland Waters, 2013, 3(1): 39-46. DOI:10.5268/iw-3.1.507 |
| [29] |
Mendonça R, Kosten S, Sobek S et al. Carbon sequestration in a large hydroelectric reservoir: An integrative seismic approach. Ecosystems, 2014, 17(3): 430-441. DOI:10.1007/s10021-013-9735-3 |
| [30] |
Wang FS, Lang YC, Liu CQ et al. Flux of organic carbon burial and carbon emission from a large reservoir: Implications for the cleanliness assessment of hydropower. Science Bulletin, 2019, 64(9): 603-611. DOI:10.1016/j.scib.2019.03.034 |
| [31] |
Grill G, Lehner B, Thieme M et al. Mapping the world's free-flowing rivers. Nature, 2019, 569(7755): 215-221. DOI:10.1038/s41586-019-1111-9 |
| [32] |
Wang FS, Wang BL, Wu XQ et al. CO2 emission from the Wan'an reservoir—Run-of-the-river reservoir in southern China. Bulletin of Mineralogy, Petrology and Geochemistry, 2017, 36(1): 40-47, 1. [汪福顺, 王宝利, 吴学谦等. 中国南方河道型水库CO2释放研究. 矿物岩石地球化学通报, 2017, 36(1): 40-47, 1. DOI:10.3969/j.issn.1007-2802.2017.01.005] |
| [33] |
Liu CQ, Wang FS, Wang YC et al. Responses of aquatic environment to river damming—From the geochemical view. Resources and Environment in the Yangtze Basin, 2009, 18(4): 384-396. [刘丛强, 汪福顺, 王雨春等. 河流筑坝拦截的水环境响应——来自地球化学的视角. 长江流域资源与环境, 2009, 18(4): 384-396.] |
| [34] |
Redfield AC. The biological control of chemical factors in the environment. American Scientist, 1958, 46(3): 205-221. DOI:10.2307/27827150 |
| [35] |
Sobek S, DelSontro T, Wongfun N et al. Extreme organic carbon burial fuels intense methane bubbling in a temperate reservoir. Geophysical Research Letters, 2012, 39(1): L01401. DOI:10.1029/2011gl050144 |
| [36] |
Mendonça R, Kosten S, Sobek S et al. Hydroelectric carbon sequestration. Nature Geoscience, 2012, 5(12): 838-840. DOI:10.1038/ngeo1653 |
| [37] |
Wei YS, Zhu LY, Huang BB et al. Impacts of water level regulation on aquatic ecology in Shahe Reservoir. Acta Scientiae Circumstantiae, 2022, 42(3): 84-93. [魏源送, 朱利英, 黄炳彬等. 水位调度运行对河道型水库水生态环境的影响——以沙河水库为例. 环境科学学报, 2022, 42(3): 84-93. DOI:10.13671/j.hjkxxb.2021.0348] |
| [38] |
Li YP, Hua L, Wang PF et al. Responses of hydrodynamical characteristics to climate conditions in a channel-type reservoir. J Lake Sci, 2013, 25(3): 317-323. [李一平, 滑磊, 王沛芳等. 河道型水库水动力特征与气候条件的响应关系. 湖泊科学, 2013, 25(3): 317-323. DOI:10.18307/2013.0301] |
| [39] |
Zhang BW, Liu J, Niu FX et al. Spatial heterogeneity and influencing factors of dissolved methane in the channel-type reservoir. China Environmental Science, 2022, 42(12): 5561-5569. [张博文, 刘佳, 牛凤霞等. 河道型水库溶解甲烷浓度的空间异质性研究. 中国环境科学, 2022, 42(12): 5561-5569.] |
| [40] |
Shi LD, Sun J, Lin BL et al. Macroscopic hydro-thermal processes in a large channel-type reservoir. Journal of Hydrology: Regional Studies, 2023, 47: 101367. DOI:10.1016/j.ejrh.2023.101367 |
| [41] |
Ferland ME, Giorgio PAD, Teodoru CR et al. Long-term C accumulation and total C stocks in boreal lakes in northern Québec. Global Biogeochemical Cycles, 2012, 26(4): GB0E04. DOI:10.1029/2011GB004241 |
| [42] |
Zhang ZC. Influence of large-scale construction of hydropower stations in southwest China. Science & Technology Information, 2012(25): 128. [张志川. 西南地区大量建设水电站的影响. 科技信息, 2012(25): 128. DOI:10.3969/j.issn.1001-9960.2012.25.090] |
| [43] |
Yu YX, Liu CQ, Wang FS et al. Spatiotemporal characteristics and diffusion flux of partial pressure of dissolved carbon dioxide (pCO2) in Hongjiadu Reservoir. Chinese Journal of Ecology, 2008, 27(7): 1193-1199. |
| [44] |
Peng X, Wang BL, Zhao YC. Temporal and spatial characteristics of dissolved organic carbon in the Wujiang River, Southwest China. Acta Geochimica, 2017, 36(4): 598-604. DOI:10.1007/s11631-017-0195-x |
| [45] |
Xiang P, Wang SL, Lu WQ et al. Distribution and retention efficiency of nitrogen and phosphorus in cascade reservoirs in Wujiang River Basin. Earth and Environment, 2016, 44(5): 492-501. [向鹏, 王仕禄, 卢玮琦等. 乌江流域梯级水库的氮磷分布及其滞留效率研究. 地球与环境, 2016, 44(5): 492-501.] |
| [46] |
Han GL, Liu CQ. Water geochemistry controlled by carbonate dissolution: A study of the river waters draining Karst-dominated terrain, Guizhou Province, China. Chemical Geology, 2004, 204(1/2): 1-21. DOI:10.1016/j.chemgeo.2003.09.009 |
| [47] |
Wang FS, Yu YX, Liu CQ et al. Dissolved silicate retention and transport in cascade reservoirs in Karst Area, Southwest China. Science of the Total Environment, 2010, 408(7): 1667-1675. DOI:10.1016/j.scitotenv.2010.01.017 |
| [48] |
He YS. Water level control strategy of daily regulating reservoir of Wujiang cascade hydropower station in Guizhou. Express Water Resources & Hydropower Information, 2015, 36(4): 67-69, 77. [贺亚山. 贵州乌江梯级水电站日调节水库水位控制策略. 水利水电快报, 2015, 36(4): 67-69, 77.] |
| [49] |
Gong Y, Chen ZY, Zhang W et al. Research on interpolation method of lake terrain zoning based on orthogonal experiment optimization. Hydro-Science and Engineering, 2022(6): 78-85. [龚懿, 陈再扬, 张维等. 基于正交试验选优的湖底地形分区插值方法. 水利水运工程学报, 2022(6): 78-85. DOI:10.12170/20211103004] |
| [50] |
Jia XB, Luo WY, Wu XQ et al. Historical record of nutrients inputs into the Xin'an Reservoir and its potential environmental implication. Environmental Science and Pollution Research, 2017, 24(25): 20330-20341. DOI:10.1007/s11356-017-9537-9 |
| [51] |
Li ZX, Li JX. Quickly calculate the distance between two points and measurement error based on latitude and longitude. Geomatics & Spatial Information Technology, 2013, 36(11): 235-237. [黎珍惜, 黎家勋. 基于经纬度快速计算两点间距离及测量误差. 测绘与空间地理信息, 2013, 36(11): 235-237. DOI:10.3969/j.issn.1672-5867.2013.11.074] |
| [52] |
Müller B, Maerki M, Schmid M et al. Internal carbon and nutrient cycling in Lake Baikal: Sedimentation, upwelling, and early diagenesis. Global and Planetary Change, 2005, 46(1/2/3/4): 101-124. DOI:10.1016/j.gloplacha.2004.11.008 |
| [53] |
Vanni MJ, Renwick WH, Bowling AM et al. Nutrient stoichiometry of linked catchment-lake systems along a gradient of land use. Freshwater Biology, 2011, 56(5): 791-811. DOI:10.1111/j.1365-2427.2010.02436.x |
| [54] |
Qin YS, Xu SM, Li F et al. Study on geotechnical properties of sediment cores in western Bohai Sea. Oceanologia et Limnologia Sinica, 1983, 14(4): 305-314. [秦蕴珊, 徐善民, 李凡等. 渤海西部海底沉积物土工学性质的研究. 海洋与湖沼, 1983, 14(4): 305-314.] |
| [55] |
Liu K, Wang SL, Tan D et al. Comparative study on nitrogen and phosphorus species of Three Cascade Resvoirs in Wujiang River Basin. arth and Environment, 2022, 50(6): 821-830. [刘坤, 王仕禄, 檀迪等. 乌江流域三个梯级水库氮磷形态的比较研究. 地球与环境, 2022, 50(6): 821-830.] |
| [56] |
李彩. 乌江喀斯特流域风化、侵蚀示踪研究[学位论文]. 北京: 北京科技大学, 2017.
|
| [57] |
朱书法. 贵州典型陆地生态系统土壤中有机碳含量及碳同位素组成[学位论文]. 贵阳: 中国科学院地球化学研究所, 2006.
|
| [58] |
Davis MB, Ford MS. Sediment focusing in Mirror Lake, New Hampshire. Limnology and Oceanography Letters, 1982, 27(1): 137-150. DOI:10.4319/lo.1982.27.1.0137 |
| [59] |
Blais JM, Kalff J. The influence of lake morphometry on sediment focusing. Limnology and Oceanography, 1995, 40(3): 582-588. DOI:10.4319/lo.1995.40.3.0582 |
| [60] |
Lin X, Wang YJ, Zhang JH et al. Interception, degradation and contributions of terrestrial organic carbon obtained from lignin analysis in Wujiang River, southwest China. Acta Geochimica, 2021, 40(6): 857-870. DOI:10.1007/s11631-021-00493-z |
| [61] |
Wu XL, Xiang XH, Chen X et al. Effects of cascade reservoir dams on the streamflow and sediment transport in the Wujiang River Basin of the Yangtze River, China. Inland Waters, 2018, 8(2): 216-228. DOI:10.1080/20442041.2018.1457850 |
| [62] |
Wang Y, Hou LS, Cai YL. Scale effects of eroded sediment transport in Wujiang River Basin, Guizhou Province, China. Journal of Groundwater Science and Engineering, 2017, 5(2): 182-192. DOI:10.26599/jgse.2017.9280018 |
| [63] |
Zhou ZK, Wang YP, Yang H et al. Sedimentary record of nutrients and sources of organic matter in the Shuanglong Reservoir, Dianchi watershed, China. Environmental Science and Pollution Research, 2021, 28(14): 17763-17774. DOI:10.1007/s11356-020-12085-0 |
| [64] |
Wang ML, Zhao LY, Wan YJ et al. Tracing the organic matter source of cage culture sediments based on stable carbon and nitrogen isotopes in Poyang Lake, China. Marine Pollution Bulletin, 2022, 182: 113943. DOI:10.1016/j.marpolbul.2022.113943 |
| [65] |
Qin J, Yang H, Zhang ML et al. Sources of organic matter in the sediments of Baoxiang River reservoir, Dianchi watershed. Geographical Research, 2015, 34(1): 53-64. [秦俊, 杨浩, 张明礼等. 滇池流域宝象河水库沉积物中有机碳的来源. 地理研究, 2015, 34(1): 53-64. DOI:10.11821/dlyj201501005] |
| [66] |
Meyers PA. Applications of organic geochemistry to paleolimnological reconstructions: A summary of examples from the Laurentian Great Lakes. Organic Geochemistry, 2003, 34(2): 261-289. DOI:10.1016/s0146-6380(02)00168-7 |
| [67] |
Zhang FJ, Xue B, Yao SC. Organic carbon burial and its driving mechanism in the sediment of Lake Hulun, northeastern Inner Mongolia, since the mid-Holocene. J Lake Sci, 2018, 30(1): 234-244. [张风菊, 薛滨, 姚书春. 中全新世以来呼伦湖沉积物碳埋藏及其影响因素分析. 湖泊科学, 2018, 30(1): 234-244. DOI:10.18307/2018.0123] |
| [68] |
Li XM, Fan BW, Hou JZ et al. Characteristics of compositions of organic Matter δ13C in lake sediments from Dagze Co in Tibetan Plateau and its paleoclimatic and paleoenvironmental significance. Earth Science, 2022, 47(6): 2275-2286. [李秀美, 范宝伟, 侯居峙等. 青藏高原达则错沉积物有机碳同位素特征及古气候环境意义. 地球科学, 2022, 47(6): 2275-2286. DOI:10.3799/dqkx.2021.167] |
| [69] |
Meyers PA. Preservation of elemental and isotopic source identification of sedimentary organic matter. Chemical Geology, 1994, 114(3/4): 289-302. DOI:10.1016/0009-2541(94)90059-0 |
| [70] |
Lamb AL, Wilson GP, Leng MJ. A review of coastal palaeoclimate and relative sea-level reconstructions using δ13C and C/N ratios in organic material. Earth-Science Reviews, 2006, 75(1/2/3/4): 29-57. DOI:10.1016/j.earscirev.2005.10.003 |
| [71] |
Kendall C, Silva SR, Kelly VJ. Carbon and nitrogen isotopic compositions of particulate organic matter in four large river systems across the United States. Hydrological Processes, 2001, 15(7): 1301-1346. DOI:10.1002/hyp.216 |
| [72] |
Guo QJ, Strauss H, Chen TB et al. Tracing the source of Beijing soil organic carbon: A carbon isotope approach. Environmental Pollution, 2013, 176: 208-214. DOI:10.1016/j.envpol.2013.01.035 |
| [73] |
Tao FX, Liu CQ, Li SL. Source and flux of POC in two subtropical karstic tributaries with contrasting land use practicein the Yangtze River Basin. Applied Geochemistry, 2009, 24(11): 2102-2112. DOI:10.1016/j.apgeochem.2009.08.007 |
| [74] |
Wang WF, Li SL, Zhong J et al. CO2 emissions from karst cascade hydropower reservoirs: Mechanisms and reservoir effect. Environmental Research Letters, 2021, 16(4). DOI:10.1088/1748-9326/abe962 |
| [75] |
Ran XB, Yu ZG, Yao QZ et al. Advances in nutrient retention of dams on river. J Lake Sci, 2009, 21(5): 614-622. [冉祥滨, 于志刚, 姚庆祯等. 水库对河流营养盐滞留效应研究进展. 湖泊科学, 2009, 21(5): 614-622. DOI:10.18307/2009.0502] |
| [76] |
Ma PM, Shi LD, Zhang JF et al. Succession of phytoplankton assemblages and its influencing factors in Tangpu Reservoir, Zhejiang Province. Environmental Science, 2016, 37(12): 4560-4569. [马沛明, 施练东, 张俊芳等. 浙江汤浦水库浮游植物季节演替及其影响因子分析. 环境科学, 2016, 37(12): 4560-4569. DOI:10.13227/j.hjkx.201605095] |
| [77] |
Phyoe WW, Wang F. A review of carbon sink or source effect on artificial reservoirs. International Journal of Environmental Science and Technology, 2019, 16(4): 2161-2174. DOI:10.1007/s13762-019-02237-2 |
| [78] |
Wang S, Qian X, Han BP et al. Effects of local climate and hydrological conditions on the thermal regime of a reservoir at Tropic of Cancer, in Southern China. Water Research, 2012, 46(8): 2591-2604. DOI:10.1016/j.watres.2012.02.014 |
| [79] |
Sobek S, Durisch-Kaiser E, Zurbrügg R et al. Organic carbon burial efficiency in lake sediments controlled by oxygen exposure time and sediment source. Limnology and Oceanography, 2009, 54(6): 2243-2254. DOI:10.4319/lo.2009.54.6.2243 |
| [80] |
Mulholland PJ, Elwood JW. The role of lake and reservoir sediments as sinks in the perturbed global carbon cycle. Tellus, 1982, 34(5): 490-499. DOI:10.1111/j.2153-3490.1982.tb01837.x |
| [81] |
贾晓斌. 新安江水库水环境演变的沉积物记录及碳埋藏研究[学位论文]. 上海: 上海大学, 2017.
|
| [82] |
Carnero-Bravo V, Merino-Ibarra M, Ruiz-Fernández AC et al. Sedimentary record of water column trophic conditions and sediment carbon fluxes in a tropical water reservoir(Valle de Bravo, Mexico). Environmental Science and Pollution Research, 2015, 22(6): 4680-4694. DOI:10.1007/s11356-014-3703-0 |
 2024, Vol. 36


